


How to use Sentry to monitor your serverless app
In this example we will look at how to use Sentry to monitor the Lambda functions in your SST serverless application.
Requirements
- Node.js 16 or later
- We’ll be using TypeScript
- An AWS account with the AWS CLI configured locally
- A Sentry account
What is Sentry
When a serverless app is deployed to production, it’s useful to be able to monitor your Lambda functions. There are a few different services that you can use for this. One of them is Sentry. Sentry offers Serverless Error and Performance Monitoring for your Lambda functions.
Create an SST app
 Let’s start by creating an SST app.
$ npx create-sst@latest --template=base/example sentry
$ cd sentry
$ npm install
By default, our app will be deployed to the us-east-1 AWS region. This can be changed in the sst.config.ts in your project root.
import { SSTConfig } from "sst";
export default {
config(_input) {
return {
name: "sentry",
region: "us-east-1",
};
},
} satisfies SSTConfig;
Project layout
An SST app is made up of a couple of parts.
-
stacks/— App InfrastructureThe code that describes the infrastructure of your serverless app is placed in the
stacks/directory of your project. SST uses AWS CDK, to create the infrastructure. -
packages/functions/— App CodeThe code that’s run when your API is invoked is placed in the
packages/functions/directory of your project.
Create our infrastructure
Our app is going to be a simple API that returns a Hello World response.
Creating our API
Let’s add the API.
Replace the stacks/ExampleStack.ts with the following.
import { LayerVersion } from "aws-cdk-lib/aws-lambda";
import { Api, StackContext } from "sst/constructs";
export function ExampleStack({ stack, app }: StackContext) {
// Create a HTTP API
const api = new Api(stack, "Api", {
routes: {
"GET /": "packages/functions/src/lambda.handler",
},
});
// Show the endpoint in the output
stack.addOutputs({
ApiEndpoint: api.url,
});
}
We are using the SST Api construct to create our API. It simply has one endpoint at the root. When we make a GET request to this endpoint the function called handler in packages/functions/src/lambda.ts will get invoked.
Your packages/functions/src/lambda.ts should look something like this.
import { APIGatewayProxyHandlerV2 } from "aws-lambda";
export const handler: APIGatewayProxyHandlerV2 = async (event) => {
return {
statusCode: 200,
headers: { "Content-Type": "text/plain" },
body: `Hello, World! Your request was received at ${event.requestContext.time}.`,
};
};
Setting up our app with Sentry
We are now ready to use Sentry to monitor our API. Sentry offers Serverless Error and Performance Monitoring for your Lambda functions. Integration is done through a Lambda Layer.
Go to the Settings > Projects. Select the project. Then scroll down to SDK SETUP and select Client Keys (DSN). And copy the DSN.
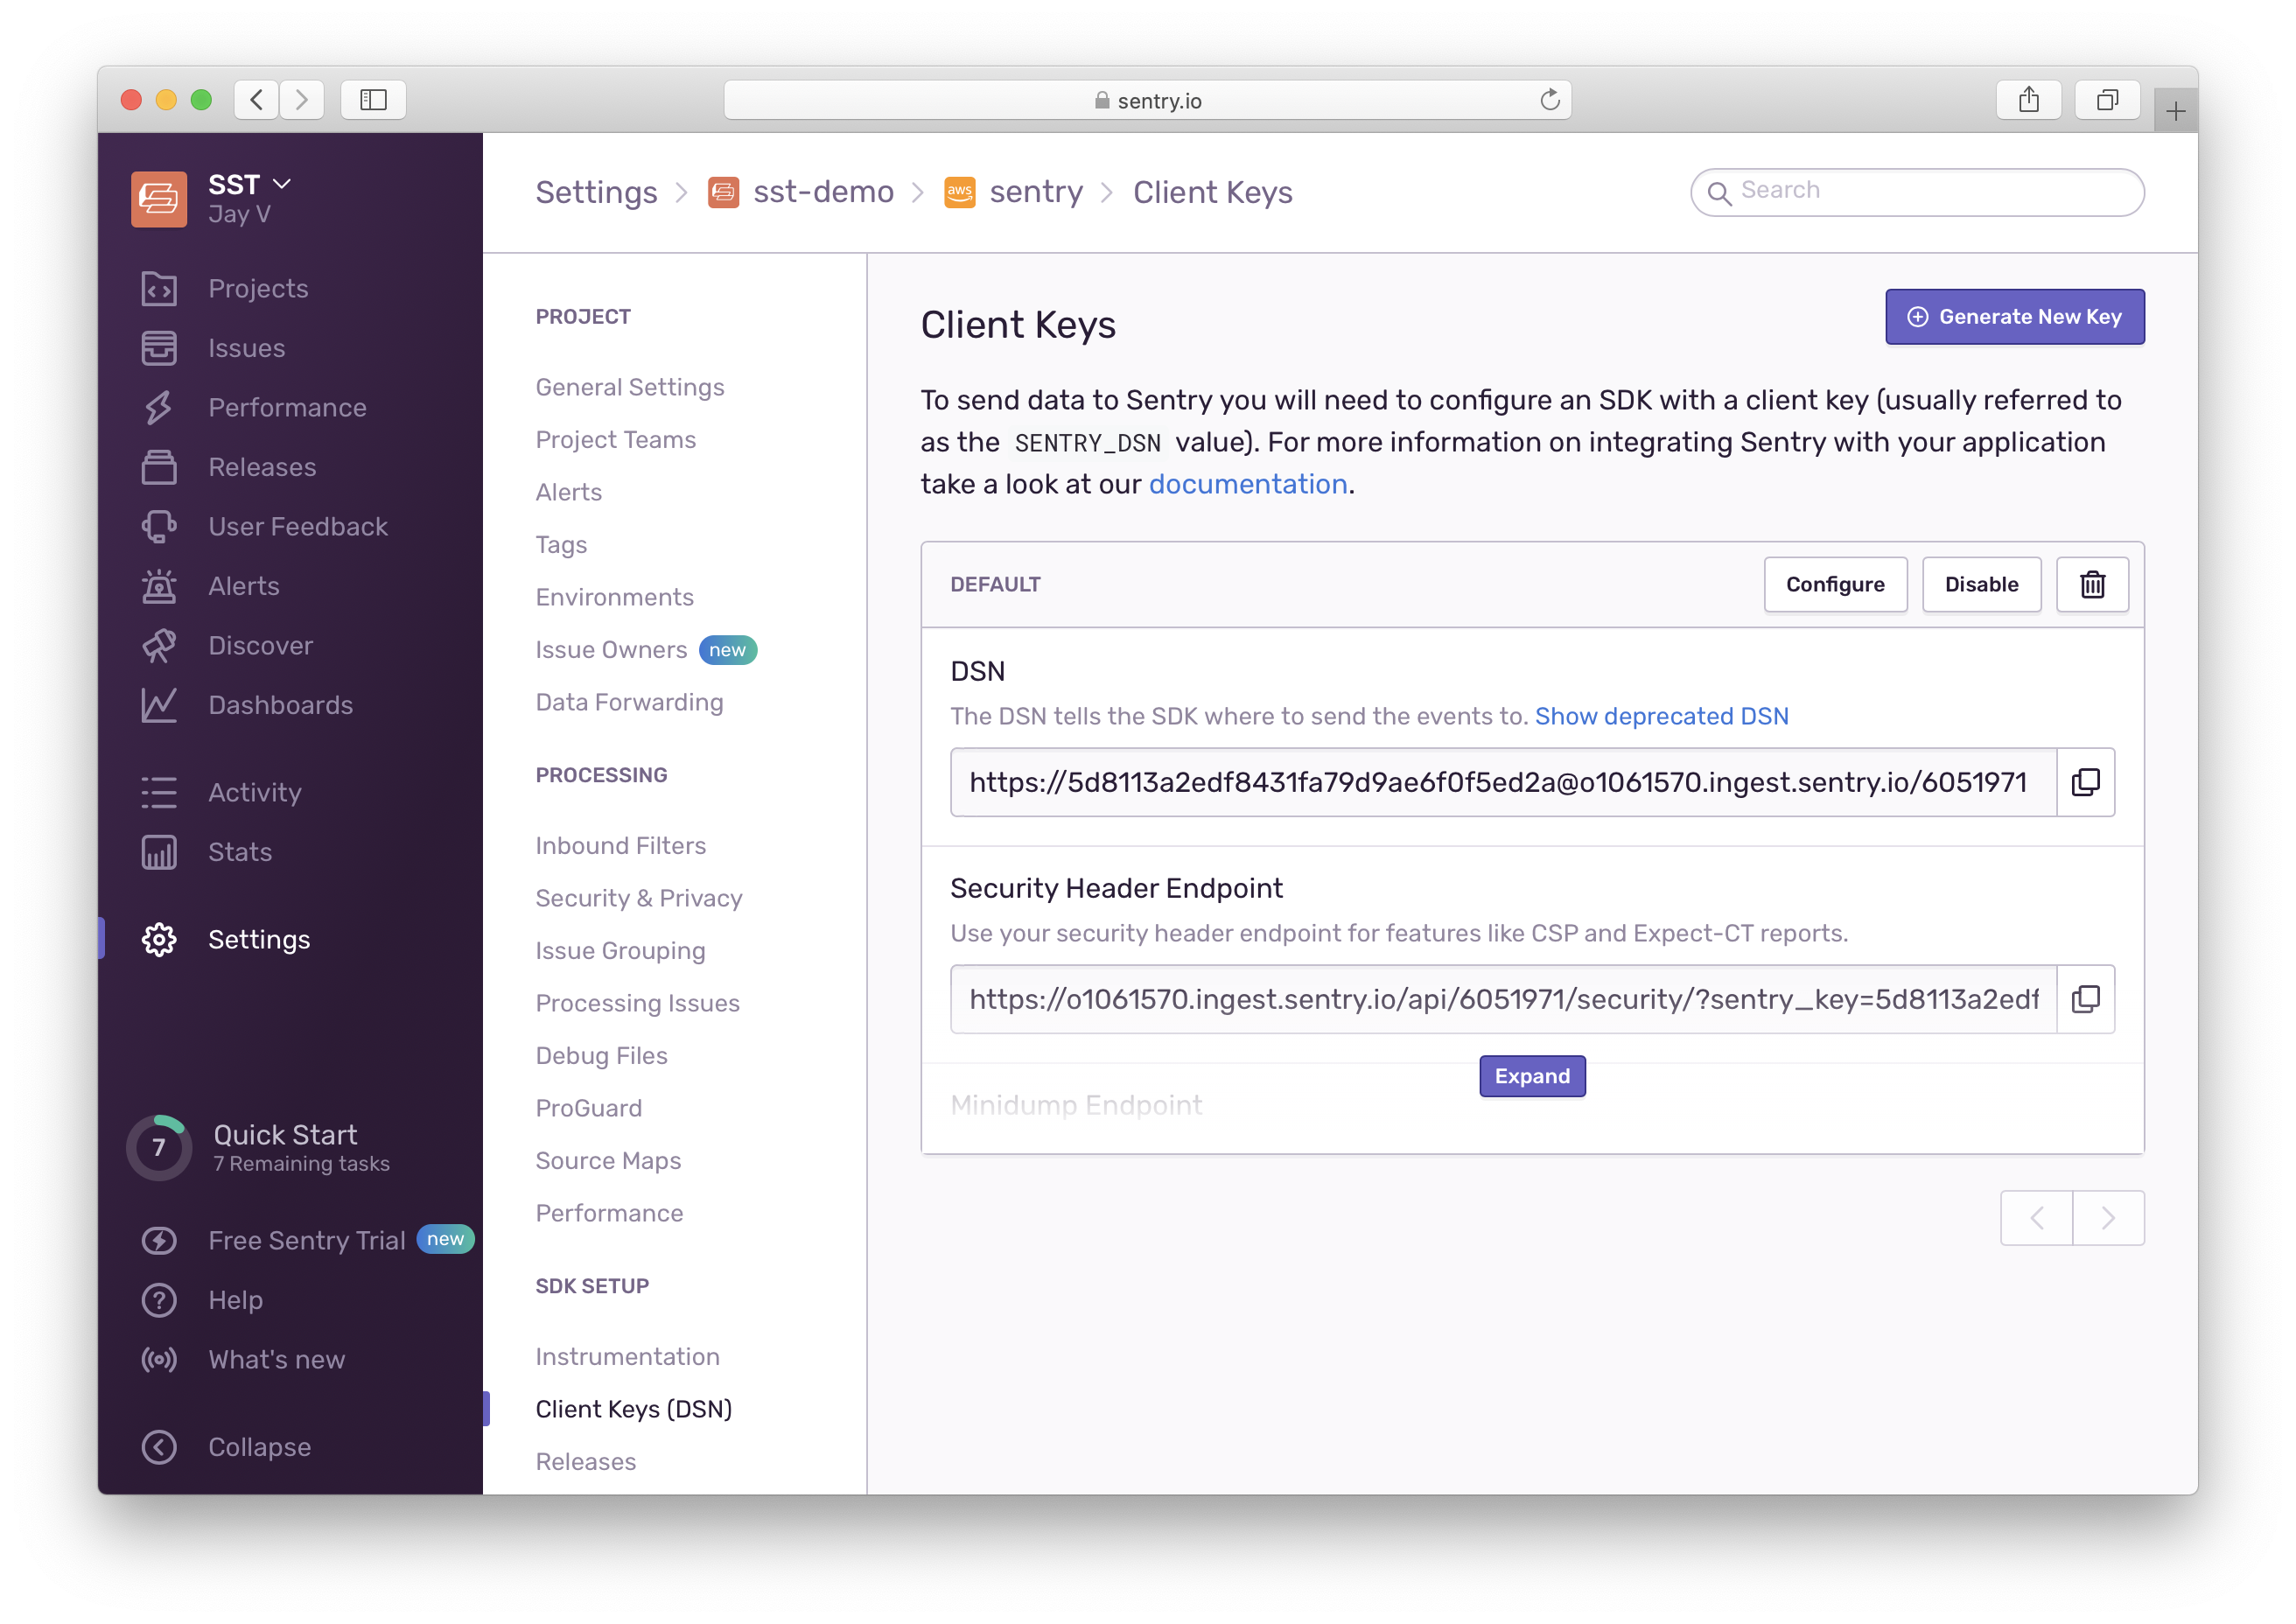
Create a .env.local file with the SENTRY_DSN in your project root.
SENTRY_DSN=https://xxxxxxxxxxxxxxxxxxxxxxxxxxxxxxxx@xxxxxxxx.ingest.sentry.io/xxxxxxx
Note that, this file should not be committed to Git. If you are deploying the app through a CI service, configure the SENTRY_DSN as an environment variable in the CI provider. If you are deploying through Seed, you can configure this in your stage settings.
Next, you’ll need to add the Sentry Lambda layer in your app.
Head over to the Sentry docs and get the layer they provide. Select your region and copy the layer ARN.
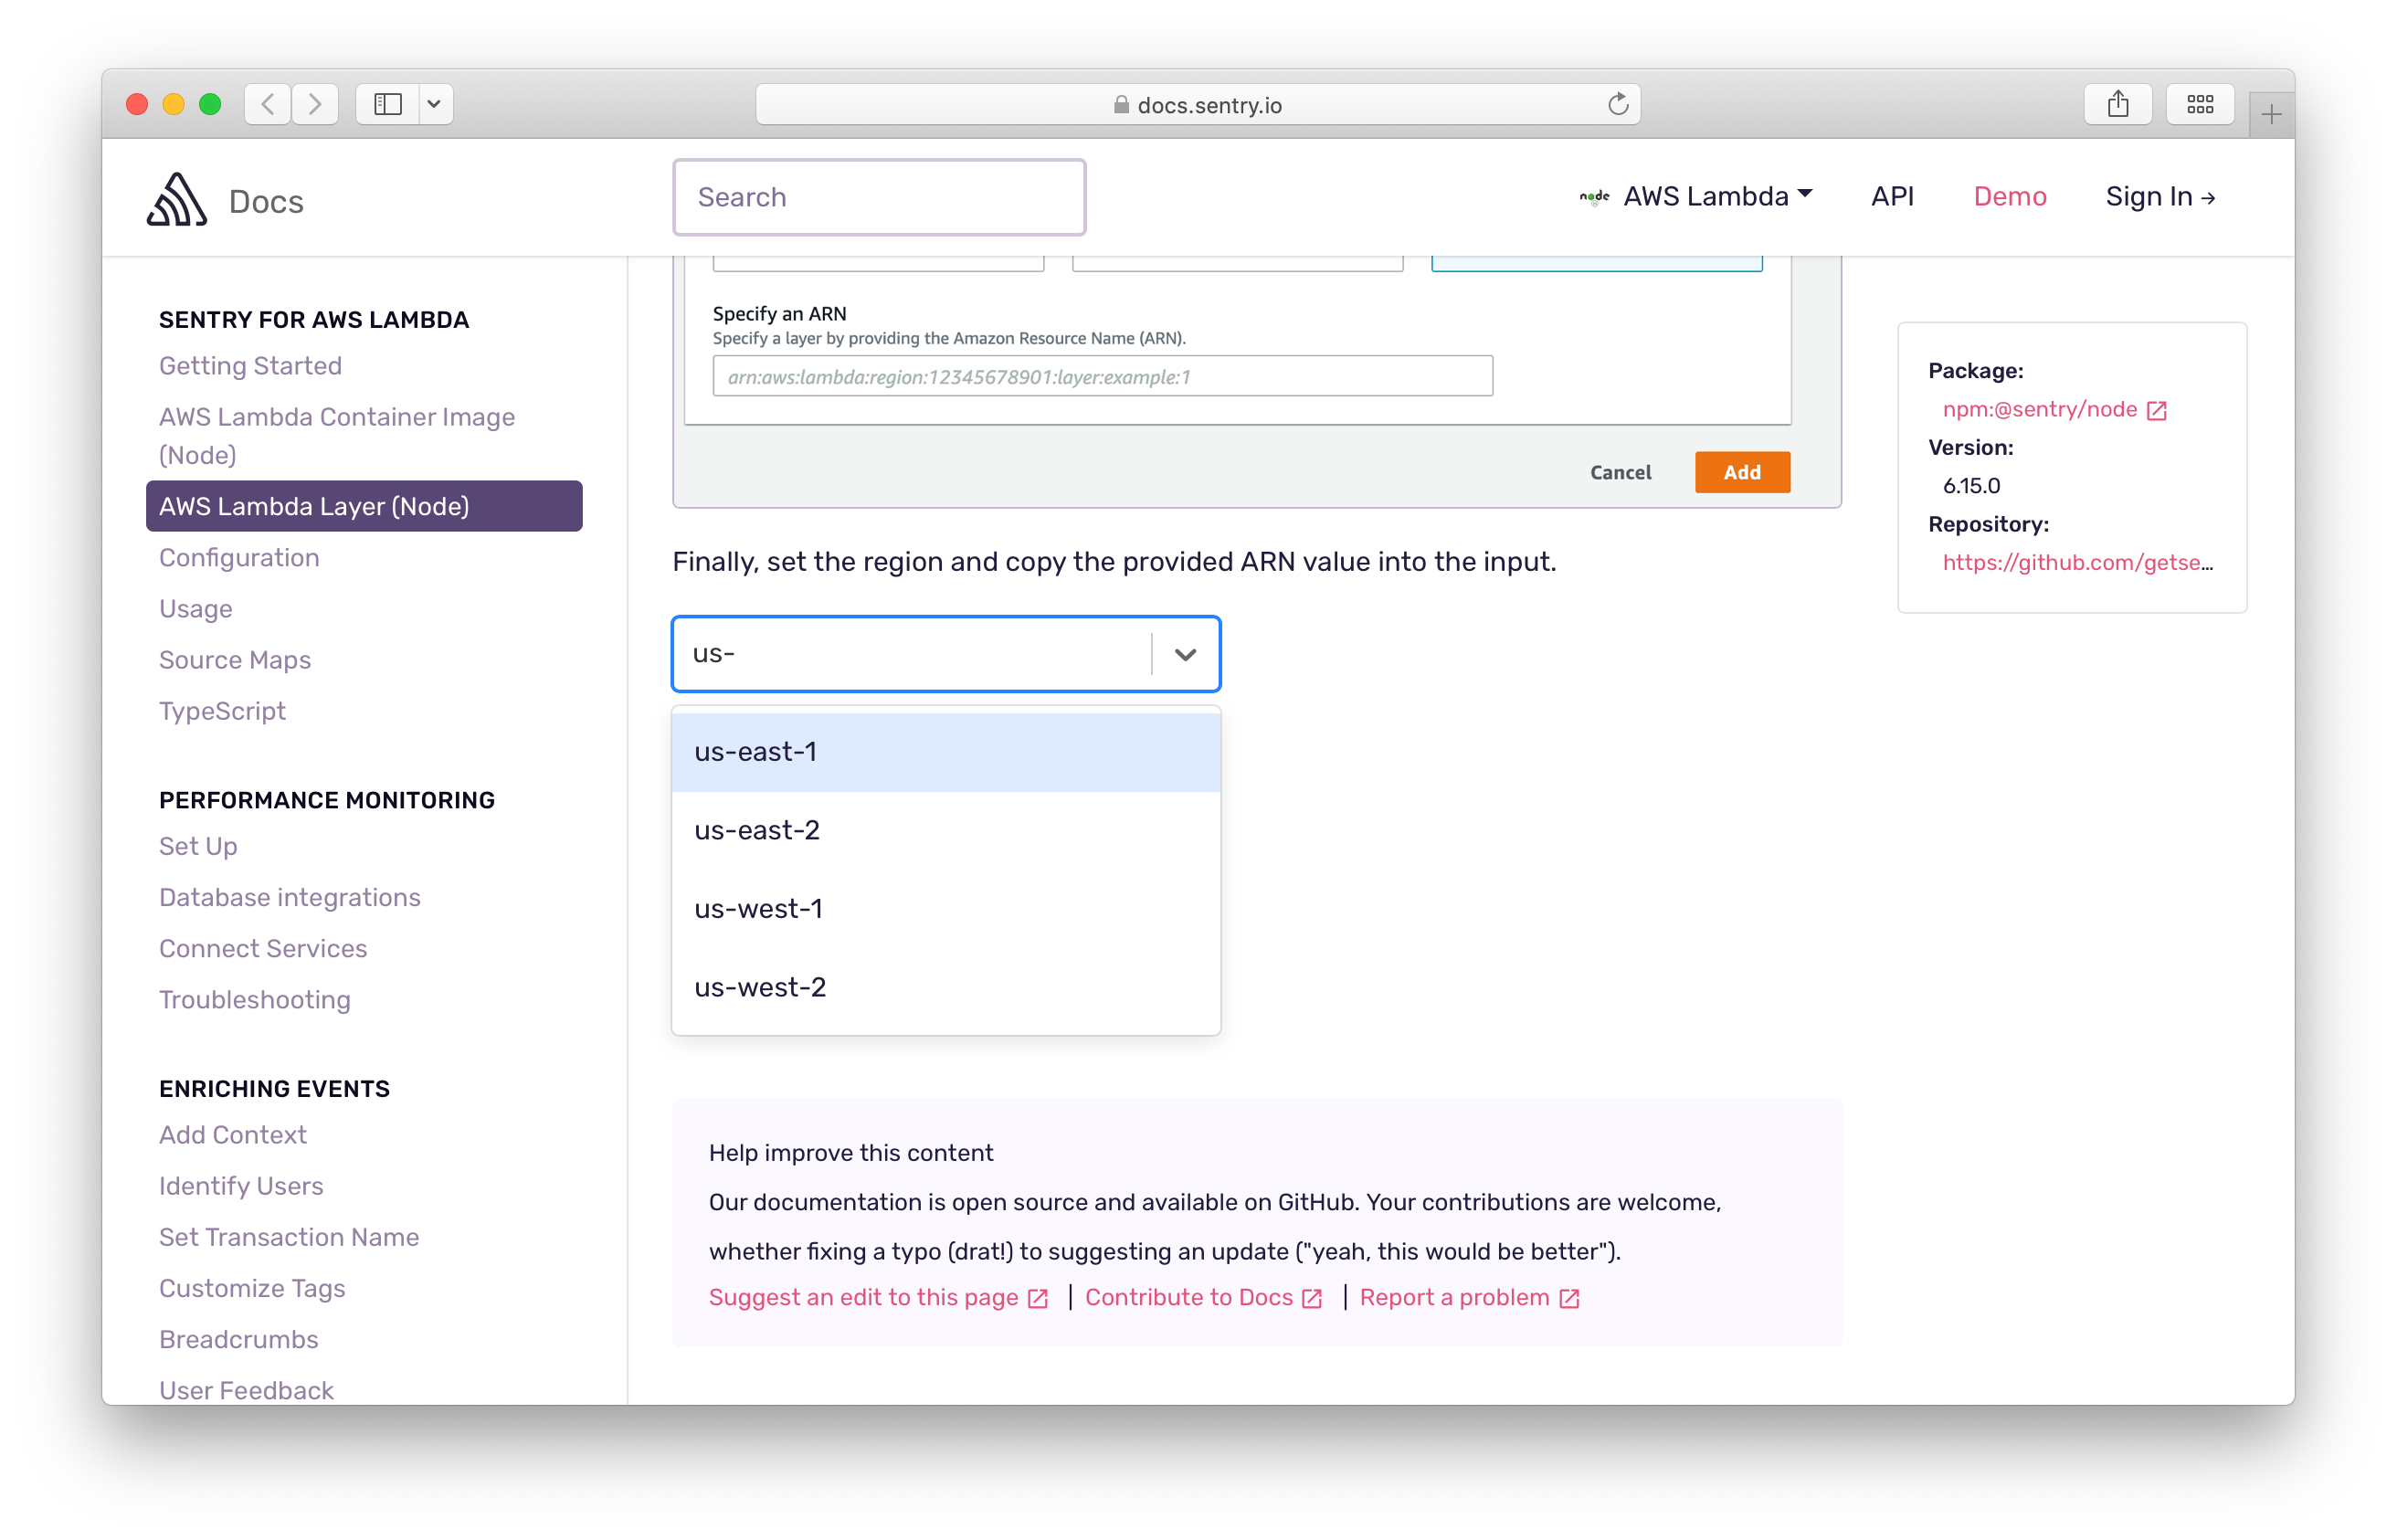
You can then set the layer for all the functions in your stack using the addDefaultFunctionLayers and addDefaultFunctionEnv. Note we only want to enable this when the function is deployed, and not when using Live Lambda Dev.
Add the following to the top of the ExampleStack function in stacks/ExampleStack.ts.
// Configure Sentry
if (!app.local) {
const sentry = LayerVersion.fromLayerVersionArn(
stack,
"SentryLayer",
`arn:aws:lambda:${app.region}:943013980633:layer:SentryNodeServerlessSDK:35`
);
stack.addDefaultFunctionLayers([sentry]);
stack.addDefaultFunctionEnv({
SENTRY_DSN: process.env.SENTRY_DSN,
SENTRY_TRACES_SAMPLE_RATE: "1.0",
NODE_OPTIONS: "-r @sentry/serverless/dist/awslambda-auto",
});
}
Note that addDefaultFunctionLayers and addDefaultFunctionEnv only affects the functions added after it’s been called. So make sure to call it at the beginning of your stack definition if you want to monitor all the Lambda functions in your stack.
Also, replace the layer ARN with the one that we copied above.
Wrapping our Lambda handler
Next, we’ll instrument our Lambda functions by wrapping them with the Sentry handler.
Replace the code in packages/functions/src/lambda.ts with this.
import * as Sentry from "@sentry/serverless";
export const handler = Sentry.AWSLambda.wrapHandler(async (event) => {
return {
statusCode: 200,
headers: { "Content-Type": "text/plain" },
body: `Hello, World! Your request was received at ${event.requestContext.time}.`,
};
});
Let’s test what we have so far.
Deploy your app
We need to deploy the API in order to track any errors.
Run the following.
$ npx sst deploy
The first time you run this command it’ll take a couple of minutes to deploy your app from scratch.
===============
Deploying app
===============
Preparing your SST app
Transpiling source
Linting source
Deploying stacks
dev-sentry-ExampleStack: deploying...
✅ dev-sentry-ExampleStack
Stack dev-sentry-ExampleStack
Status: deployed
Outputs:
ApiEndpoint: https://753gre9wkh.execute-api.us-east-1.amazonaws.com
The ApiEndpoint is the API we just created.
Let’s test our endpoint with the SST Console. The SST Console is a web based dashboard to manage your SST apps. Learn more about it in our docs.
Go to the API tab and click Send button to send a GET request.
Note, the API explorer lets you make HTTP requests to any of the routes in your Api construct. Set the headers, query params, request body, and view the function logs with the response.
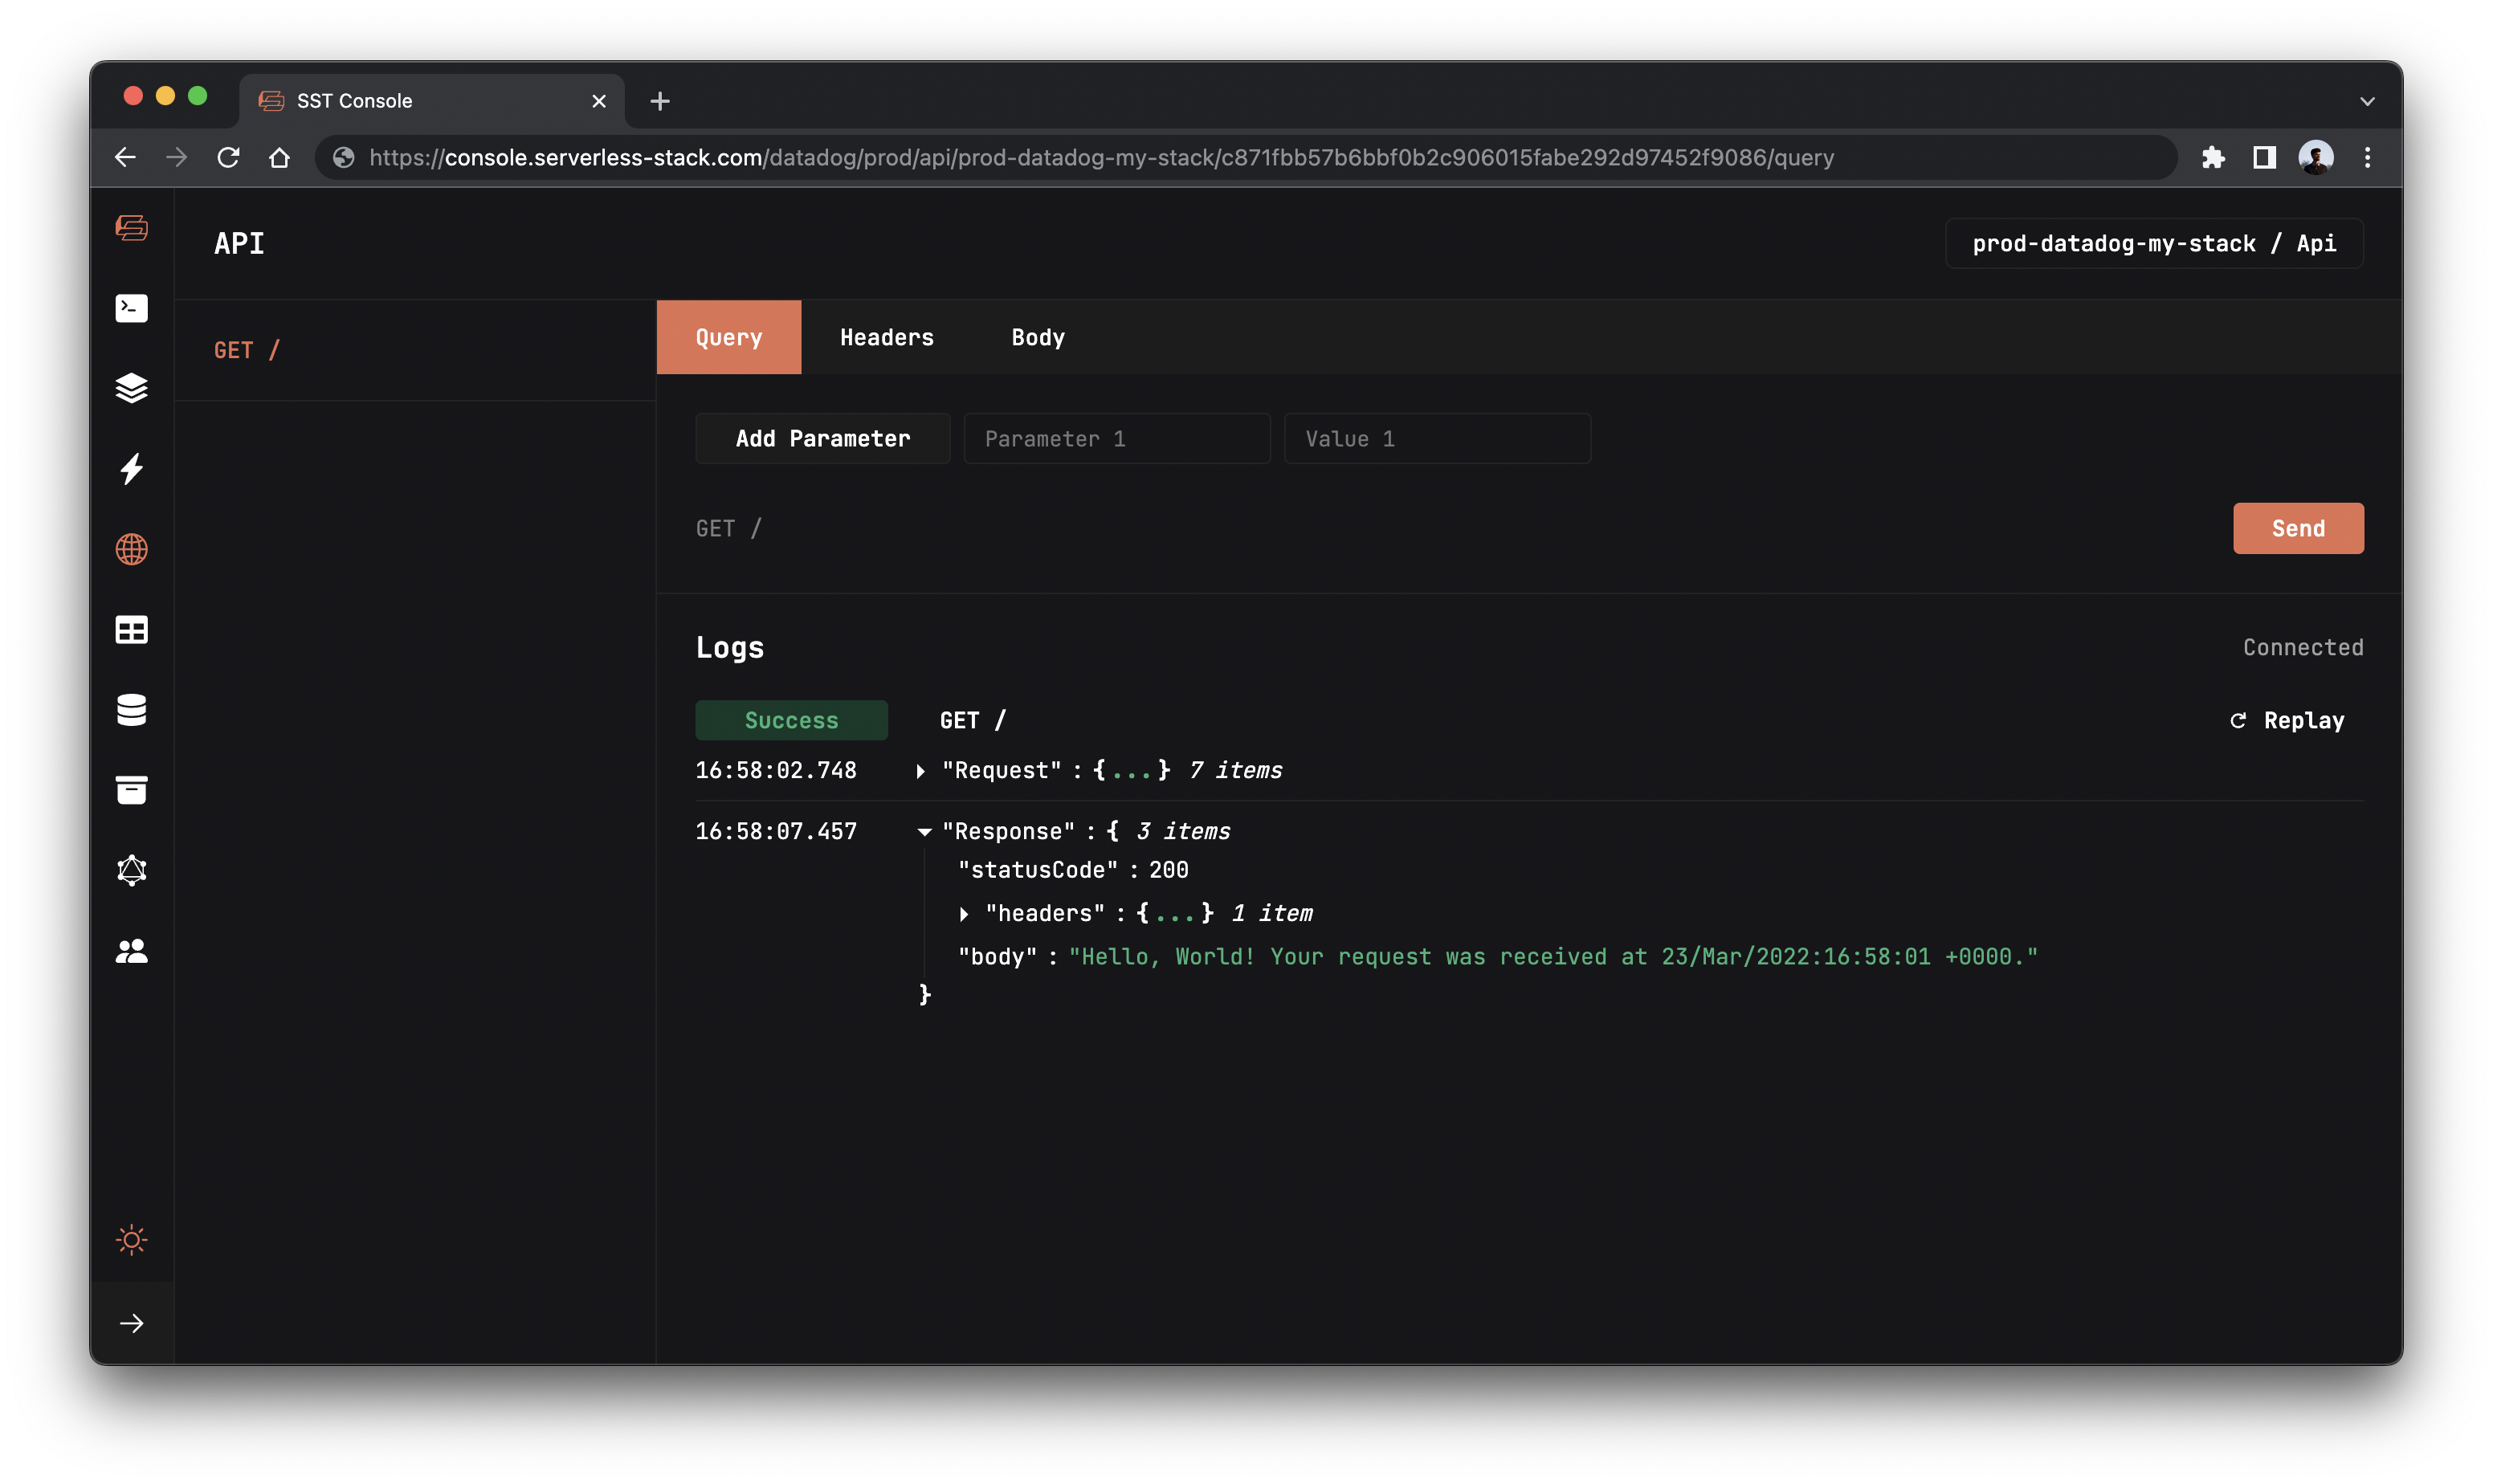
You should see the Hello World message.
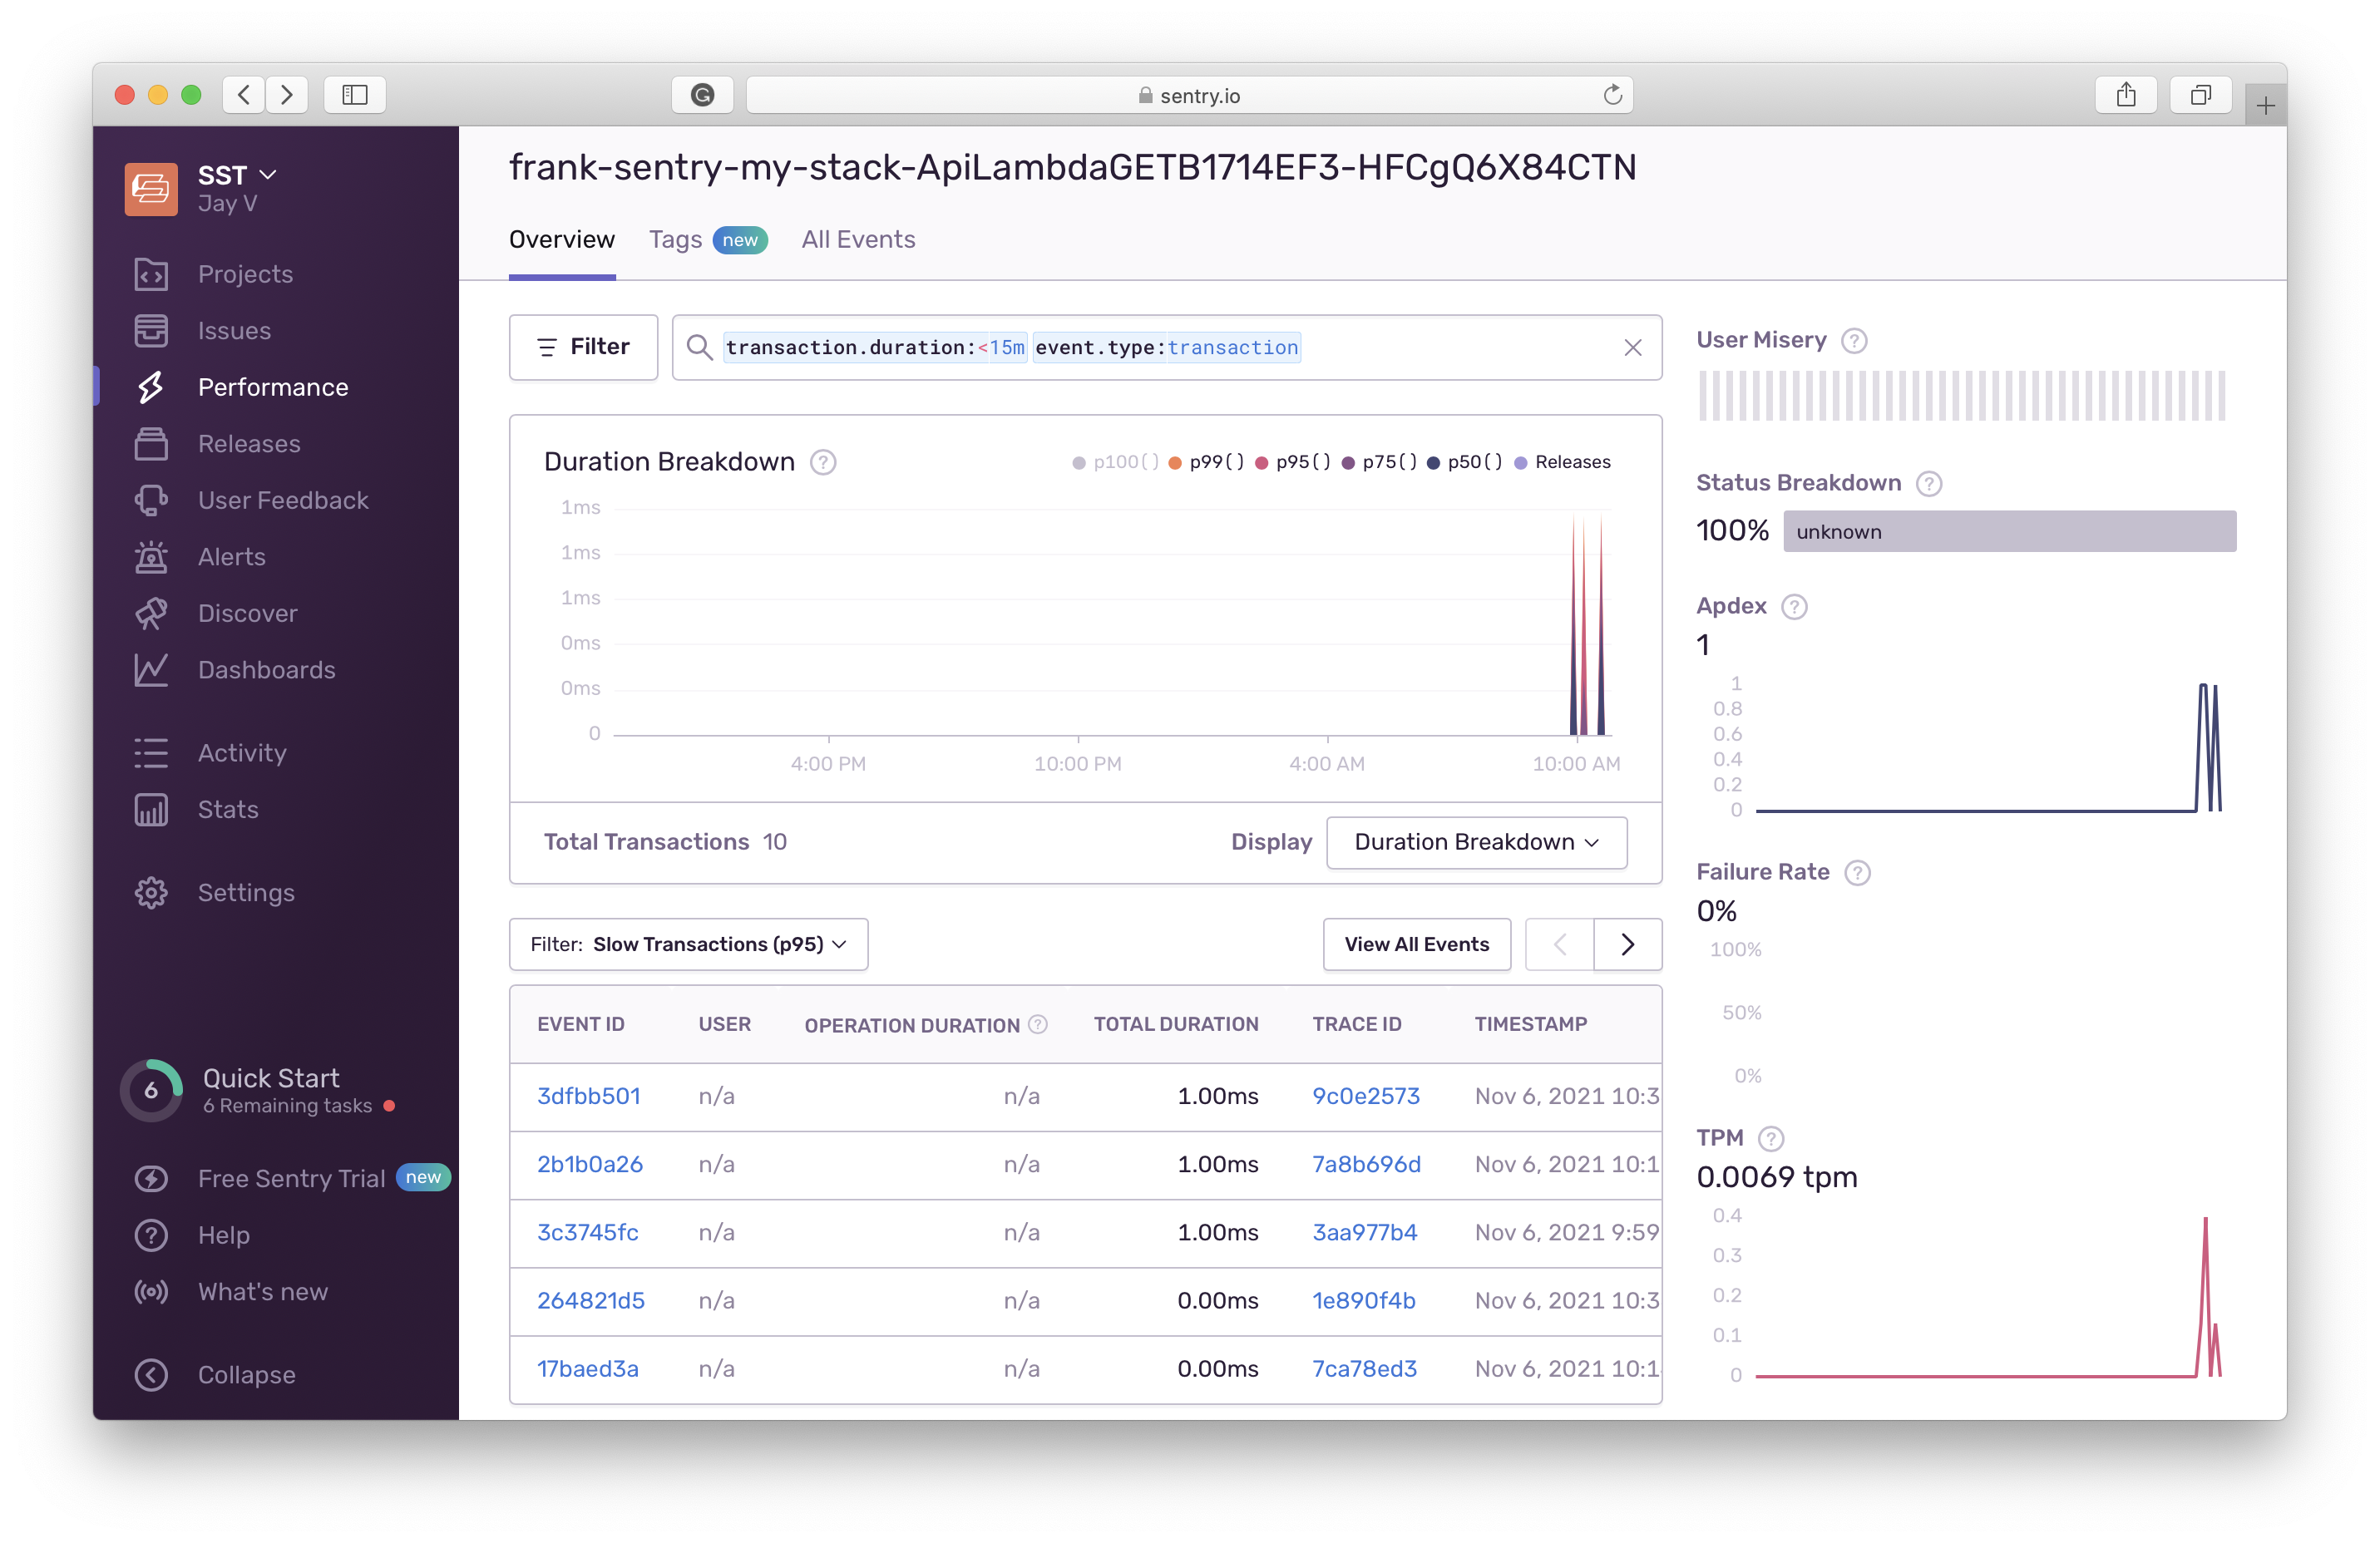
Now head over to your Sentry dashboard to start exploring key metrics like the execution duration, failure rates, and transactions per minute. You can also click through to inspect specific errors.
Cleaning up
Finally, you can remove the resources created in this example using the following.
$ npx sst remove
Conclusion
And that’s it! We’ve got a serverless API monitored with Sentry. It’s deployed to production, so you can share it with your users. Check out the repo below for the code we used in this example. And leave a comment if you have any questions!
For help and discussion
Comments on this example