


How to debug Lambda functions with IntelliJ IDEA
In this example we will look at how to debug AWS Lambda functions with IntelliJ IDEA Ultimate using SST.
SST allows you to build and test Lambda functions locally using Live Lambda Development. This means that you can attach breakpoints and inspect your Lambda functions locally, even if they are invoked remotely.
Here is a video of it in action.
Let’s look at how.
Requirements
- Node.js 16 or later
- We’ll be using TypeScript
- An AWS account with the AWS CLI configured locally
Create an SST app
 Let’s start by creating an SST app.
$ npx create-sst@latest --template=base/example intellij-idea
$ cd intellij-idea
$ npm install
By default, our app will be deployed to the us-east-1 AWS region. This can be changed in the sst.config.ts in your project root.
import { SSTConfig } from "sst";

export default {
  config(_input) {
    return {
      name: "intellij-idea",
      region: "us-east-1",
    };
  },
} satisfies SSTConfig;
Project layout
An SST app is made up of two parts.
-
stacks/— App InfrastructureThe code that describes the infrastructure of your serverless app is placed in the
stacks/directory of your project. SST uses AWS CDK, to create the infrastructure. -
packages/functions/— App CodeThe code that’s run when your API is invoked is placed in the
packages/functions/directory of your project.
Setting up our API
For this example we’ll be testing using a simple API endpoint.
Our API is defined in the stacks/ExampleStack.ts.
import { Api, StackContext } from "sst/constructs";

export function ExampleStack({ stack }: StackContext) {
  // Create a HTTP API
  const api = new Api(stack, "Api", {
    routes: {
      "GET /": "packages/functions/src/lambda.handler",
    },
  });

  // Show the endpoint in the output
  stack.addOutputs({
    ApiEndpoint: api.url,
  });
}
Adding function code
Our functions are stored in the packages/functions/ directory. In this case, we have a simple Lambda function that’s printing out the time the request was made.
Replace your packages/functions/src/lambda.ts with.
import { APIGatewayProxyHandlerV2 } from "aws-lambda";

export const handler: APIGatewayProxyHandlerV2 = async (event) => {
  const message = `The time in Lambda is ${event.requestContext.time}.`;
  return {
    statusCode: 200,
    headers: { "Content-Type": "text/plain" },
    body: `Hello, World! ${message}`,
  };
};
Adding IntelliJ IDEA Debug Configuration
To allow IntelliJ IDEA to set breakpoints and debug our Lambda functions we’ll add it to our Debug Configurations.
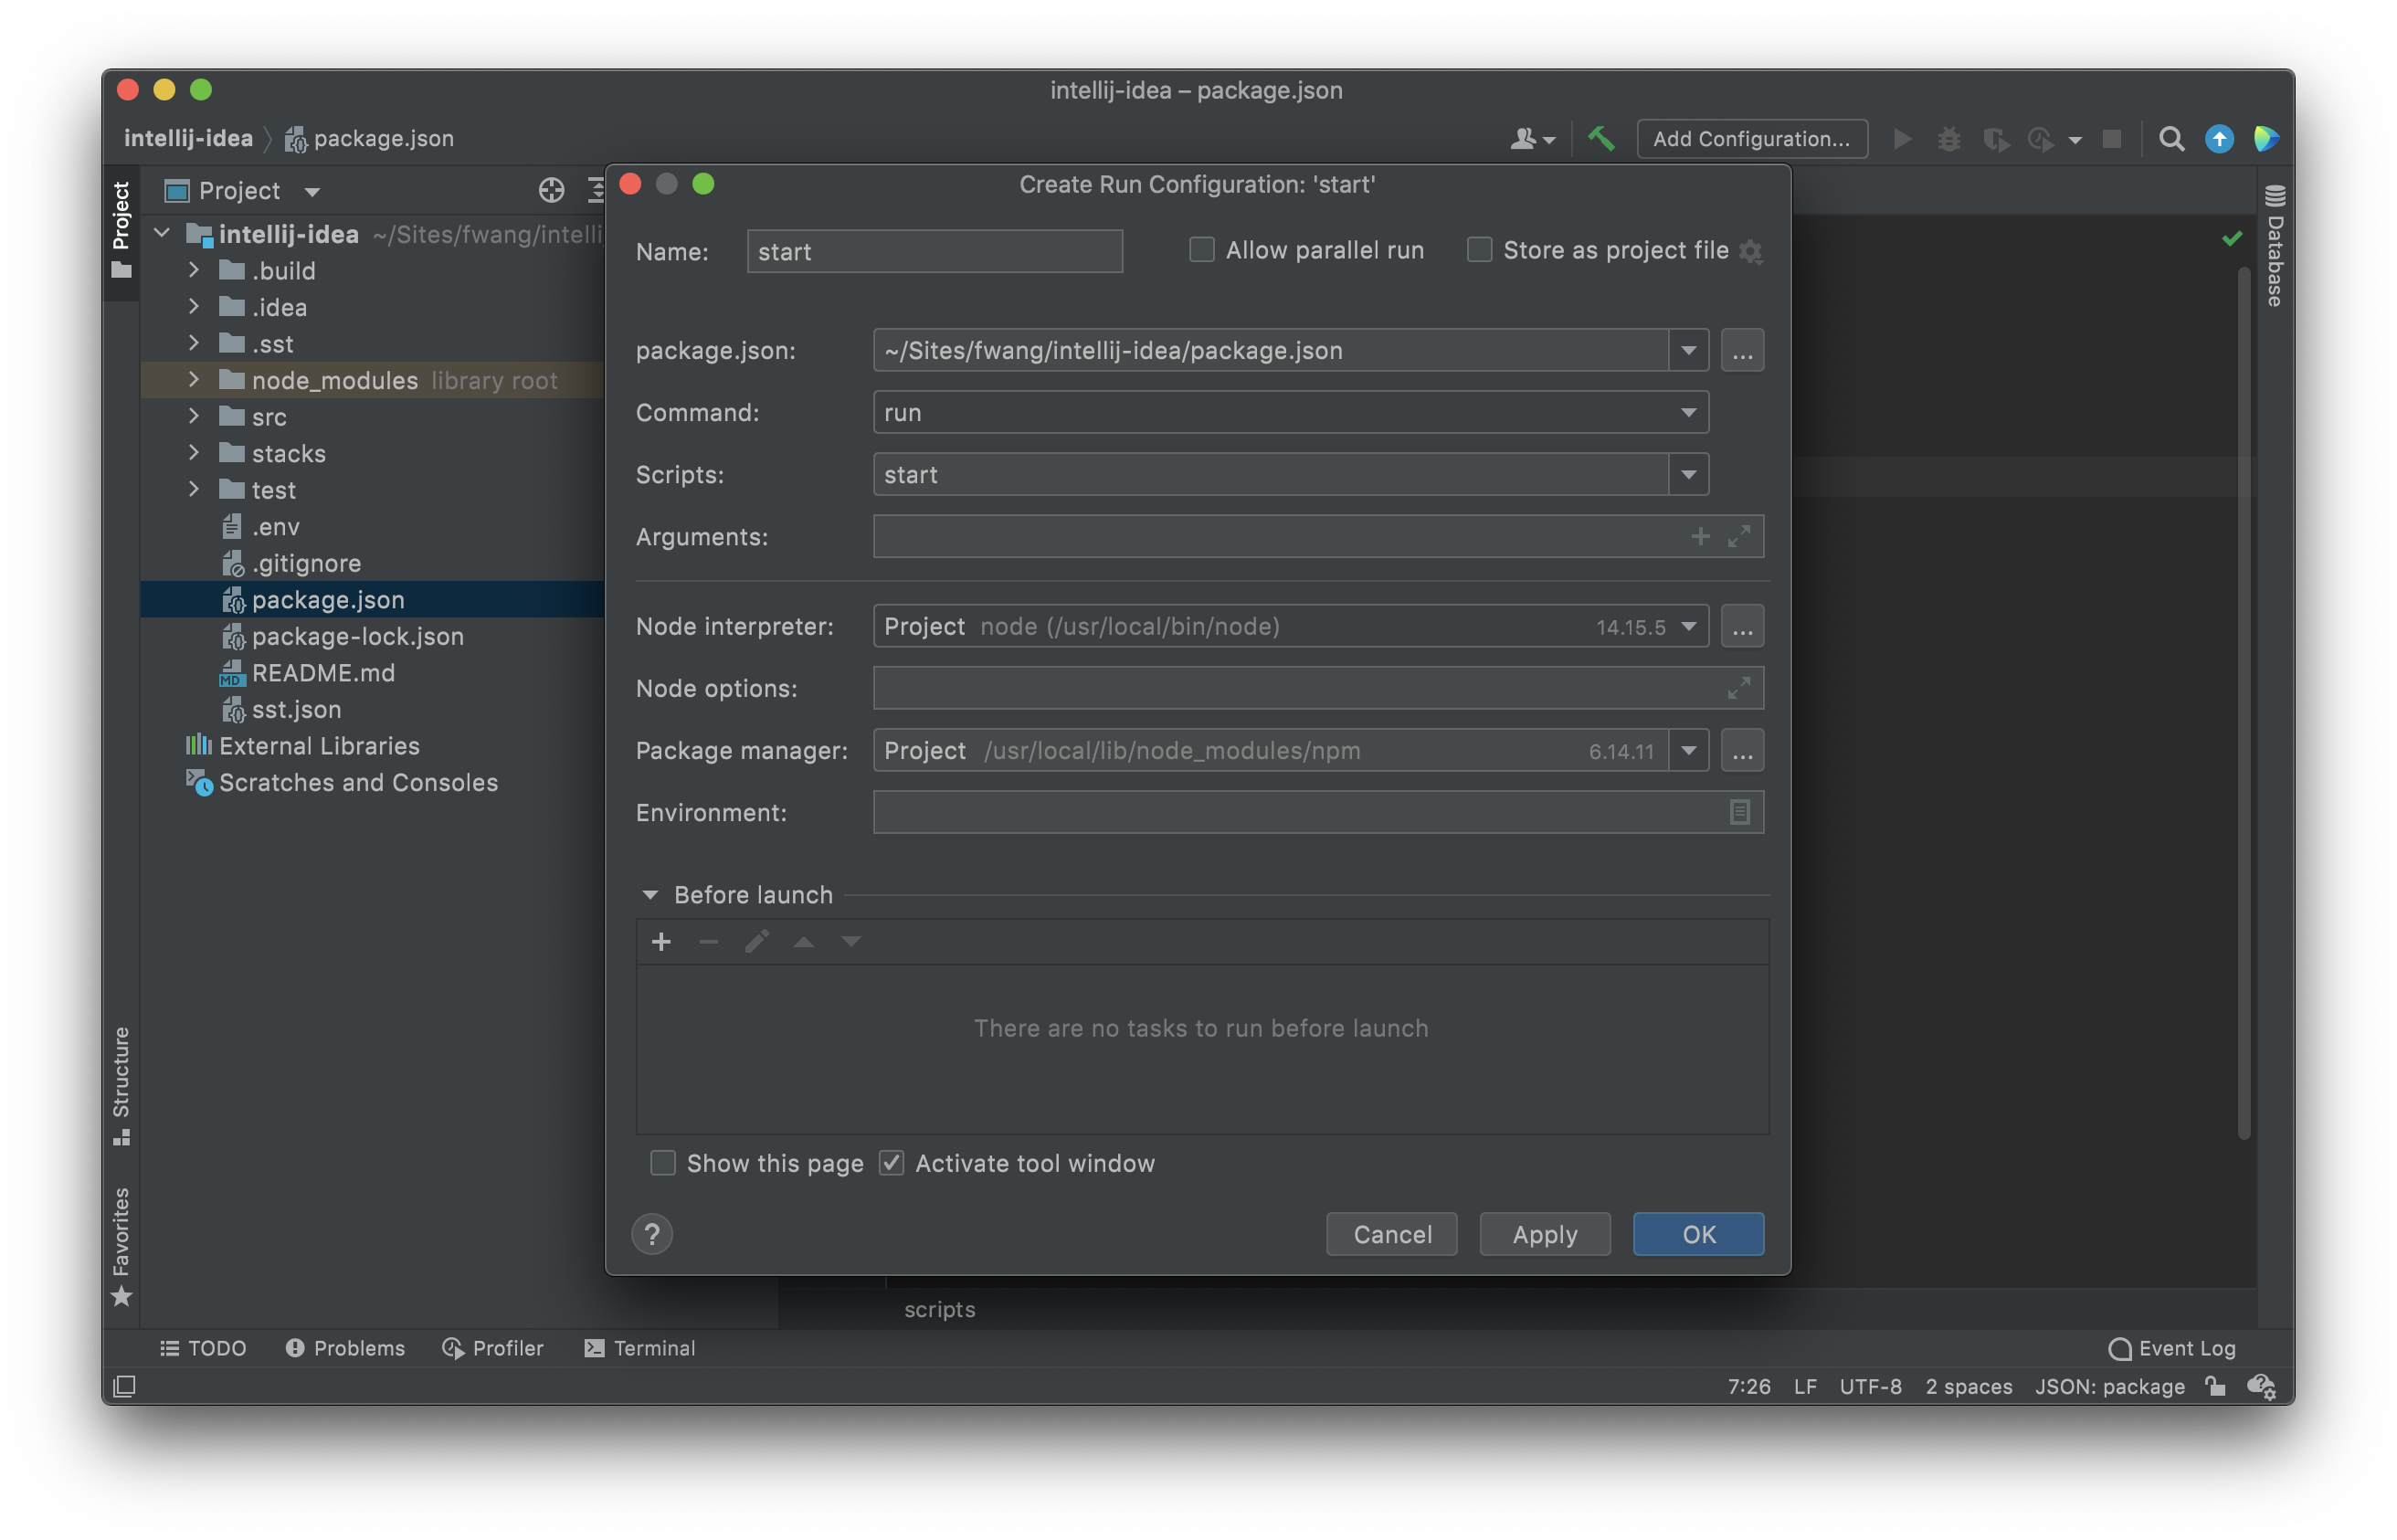
Select the package.json from the left panel, click on the ▶️ icon next to the dev script, and then select Modify Run Configuration.
![]()
It will open up a dialog where you need to configure the settings as per the project, IntelliJ IDEA does it automatically for us. Make sure your settings looks like below.
Extending Lambda function timeouts
Since we are going to set breakpoints in our Lambda functions, it makes sense to increase the timeouts.
SST has an --increase-timeout option that increases the function timeouts in your app to the maximum 15 minutes.
Add --increase-timeout to the arguments to increase the timeout.
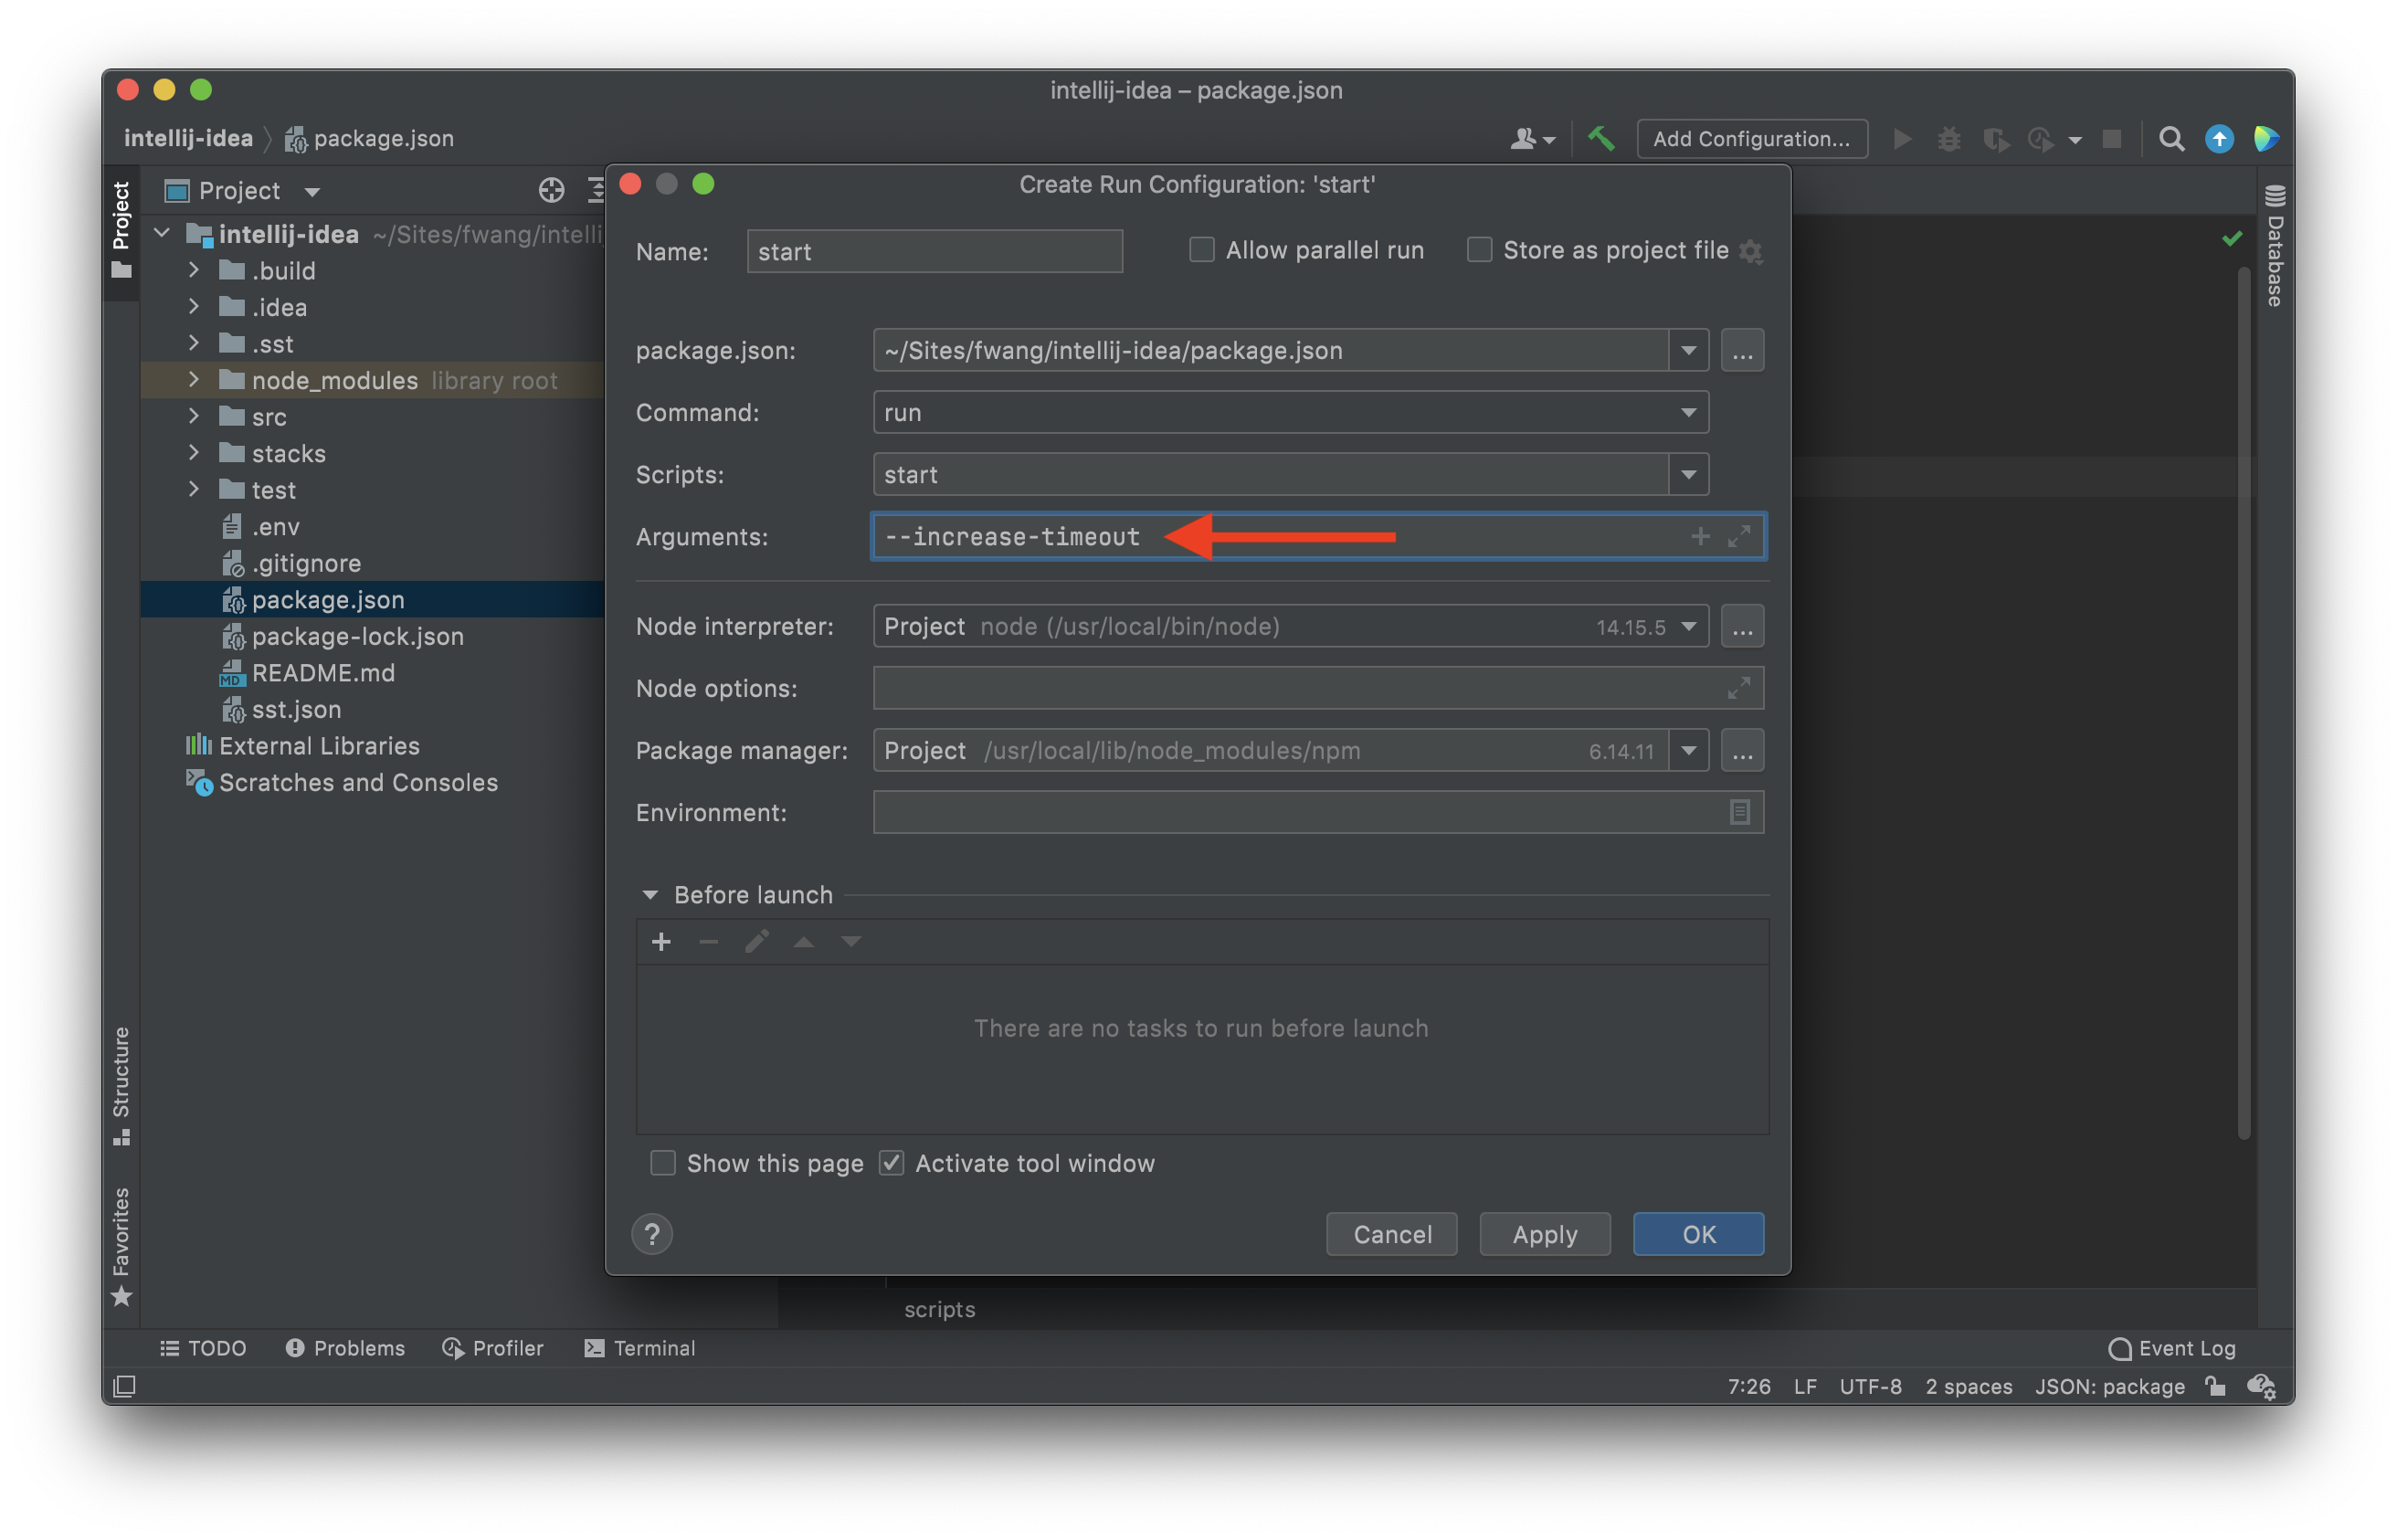
Note that, this doesn’t increase the timeout of an API. Since the API Gateway timeout cannot be increased for more than 30 seconds. But you can continue debugging the Lambda function, even after the API request times out.
Starting your dev environment
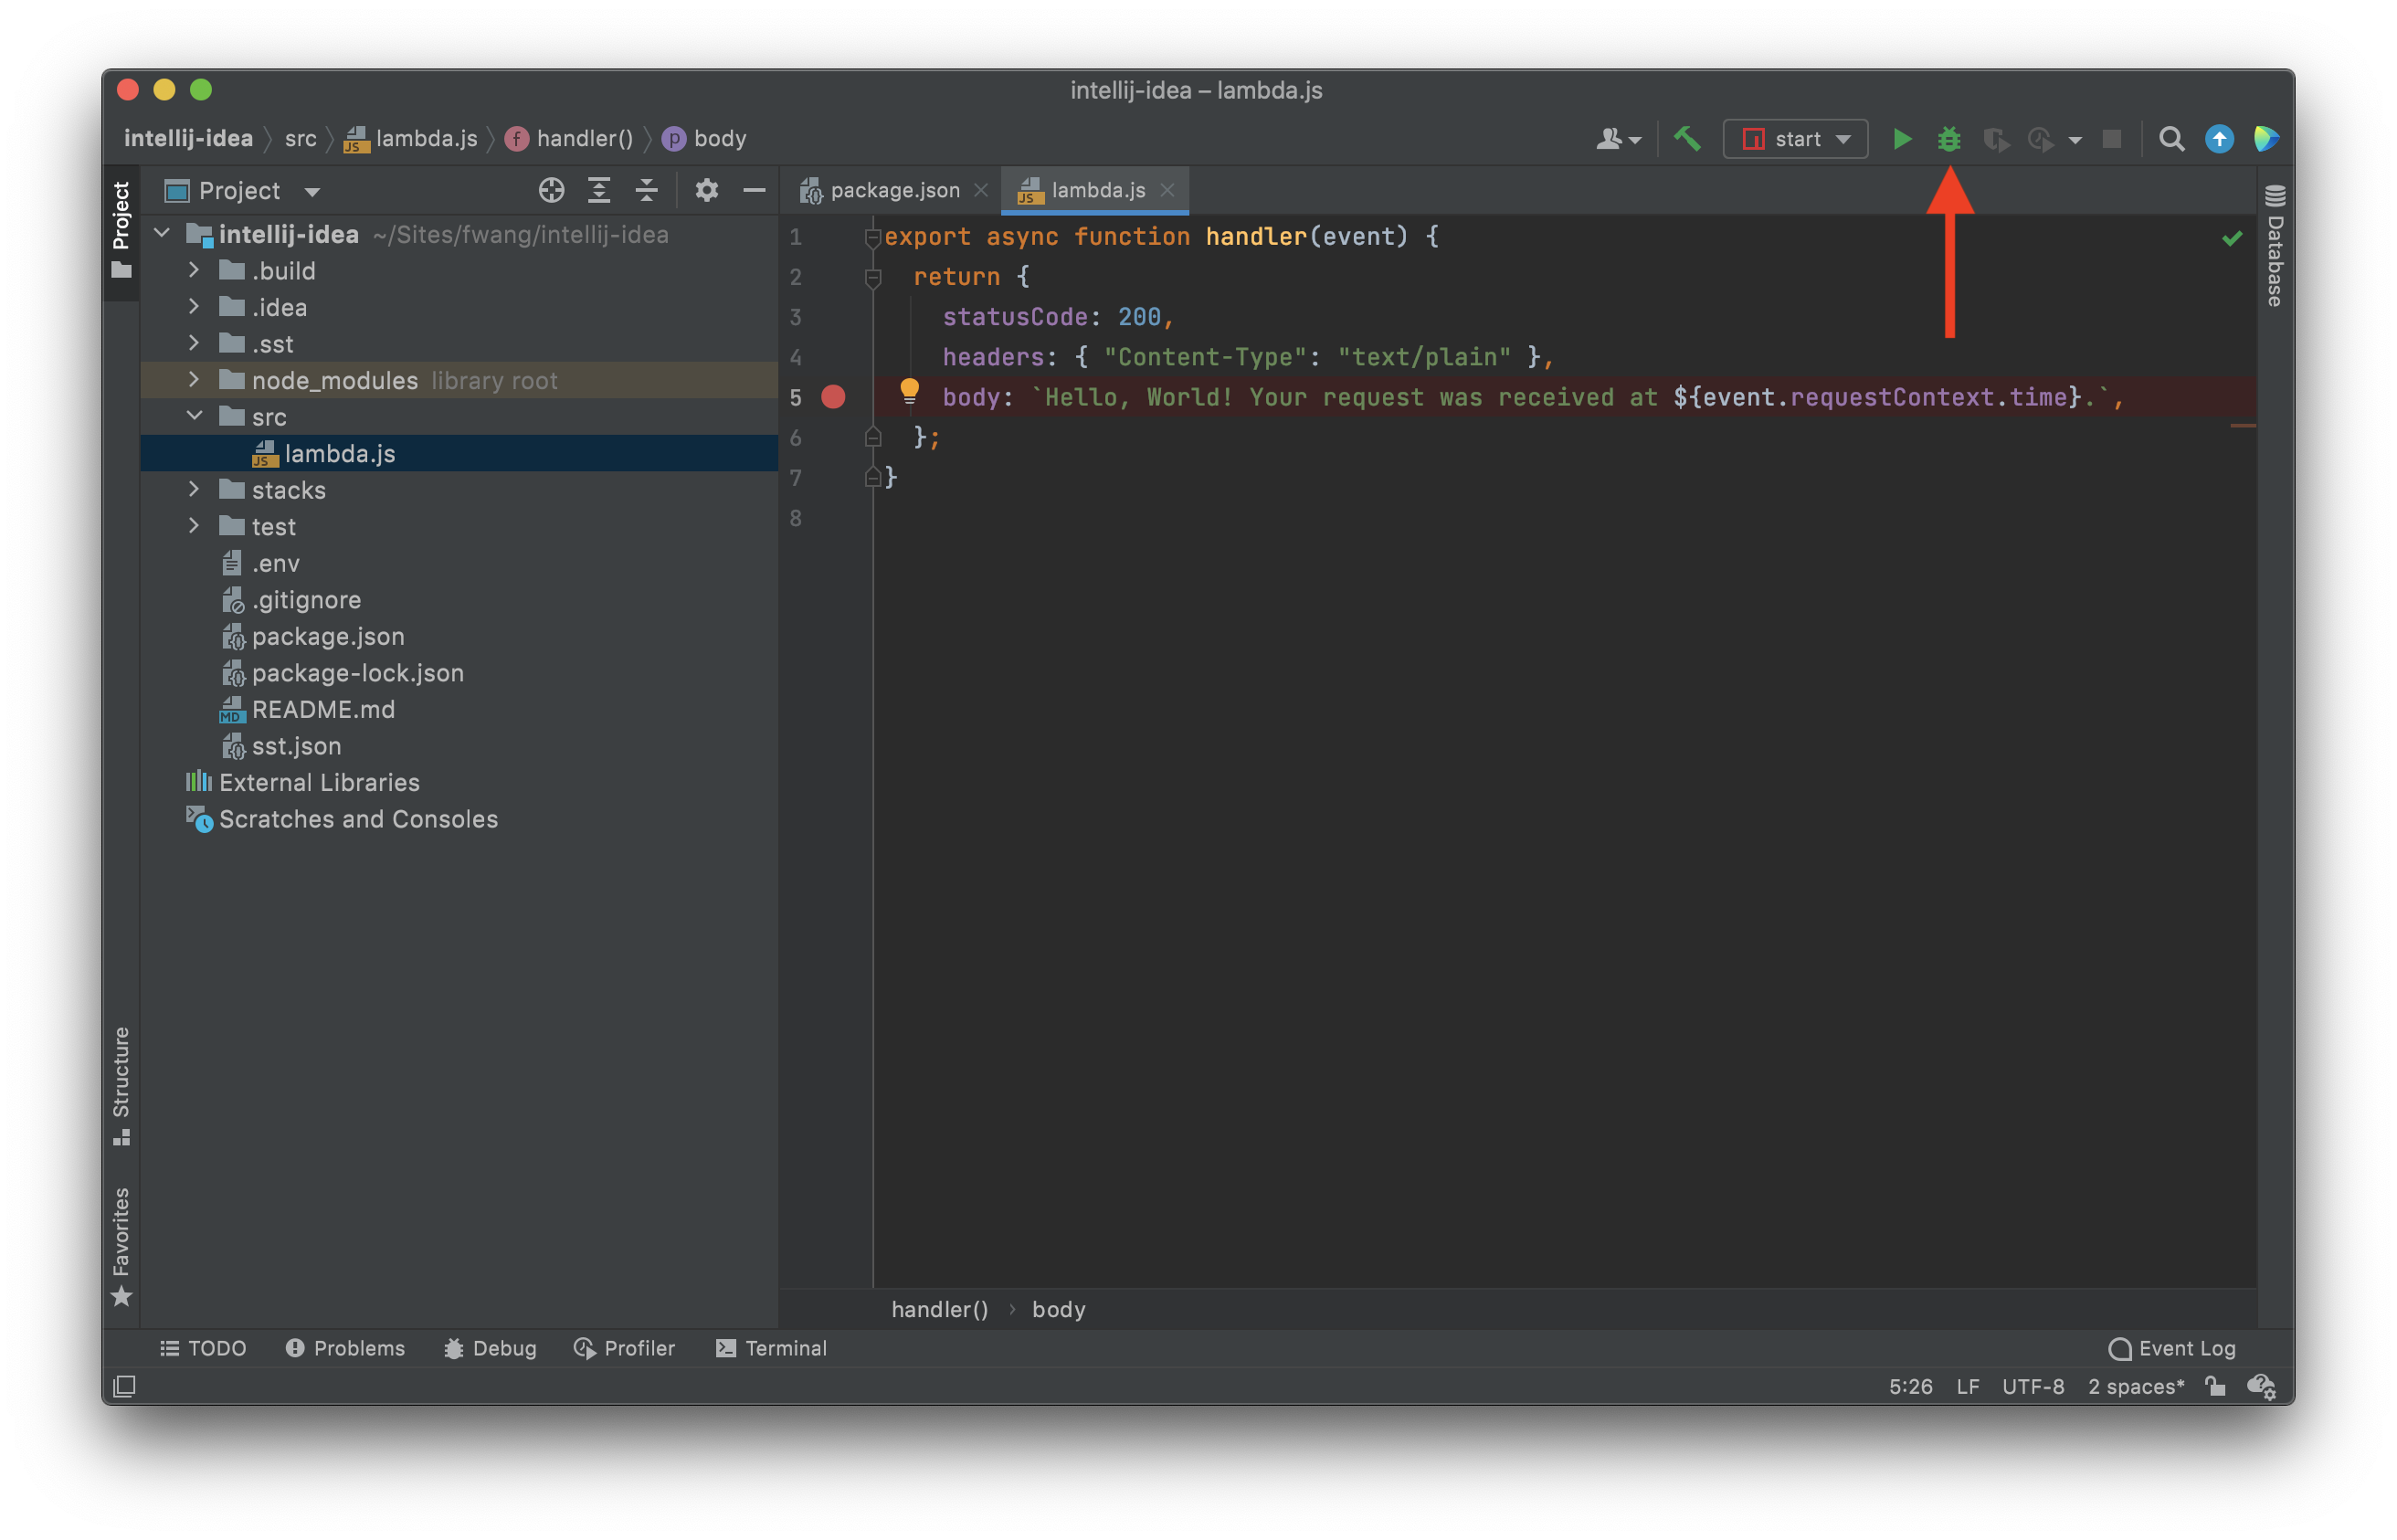
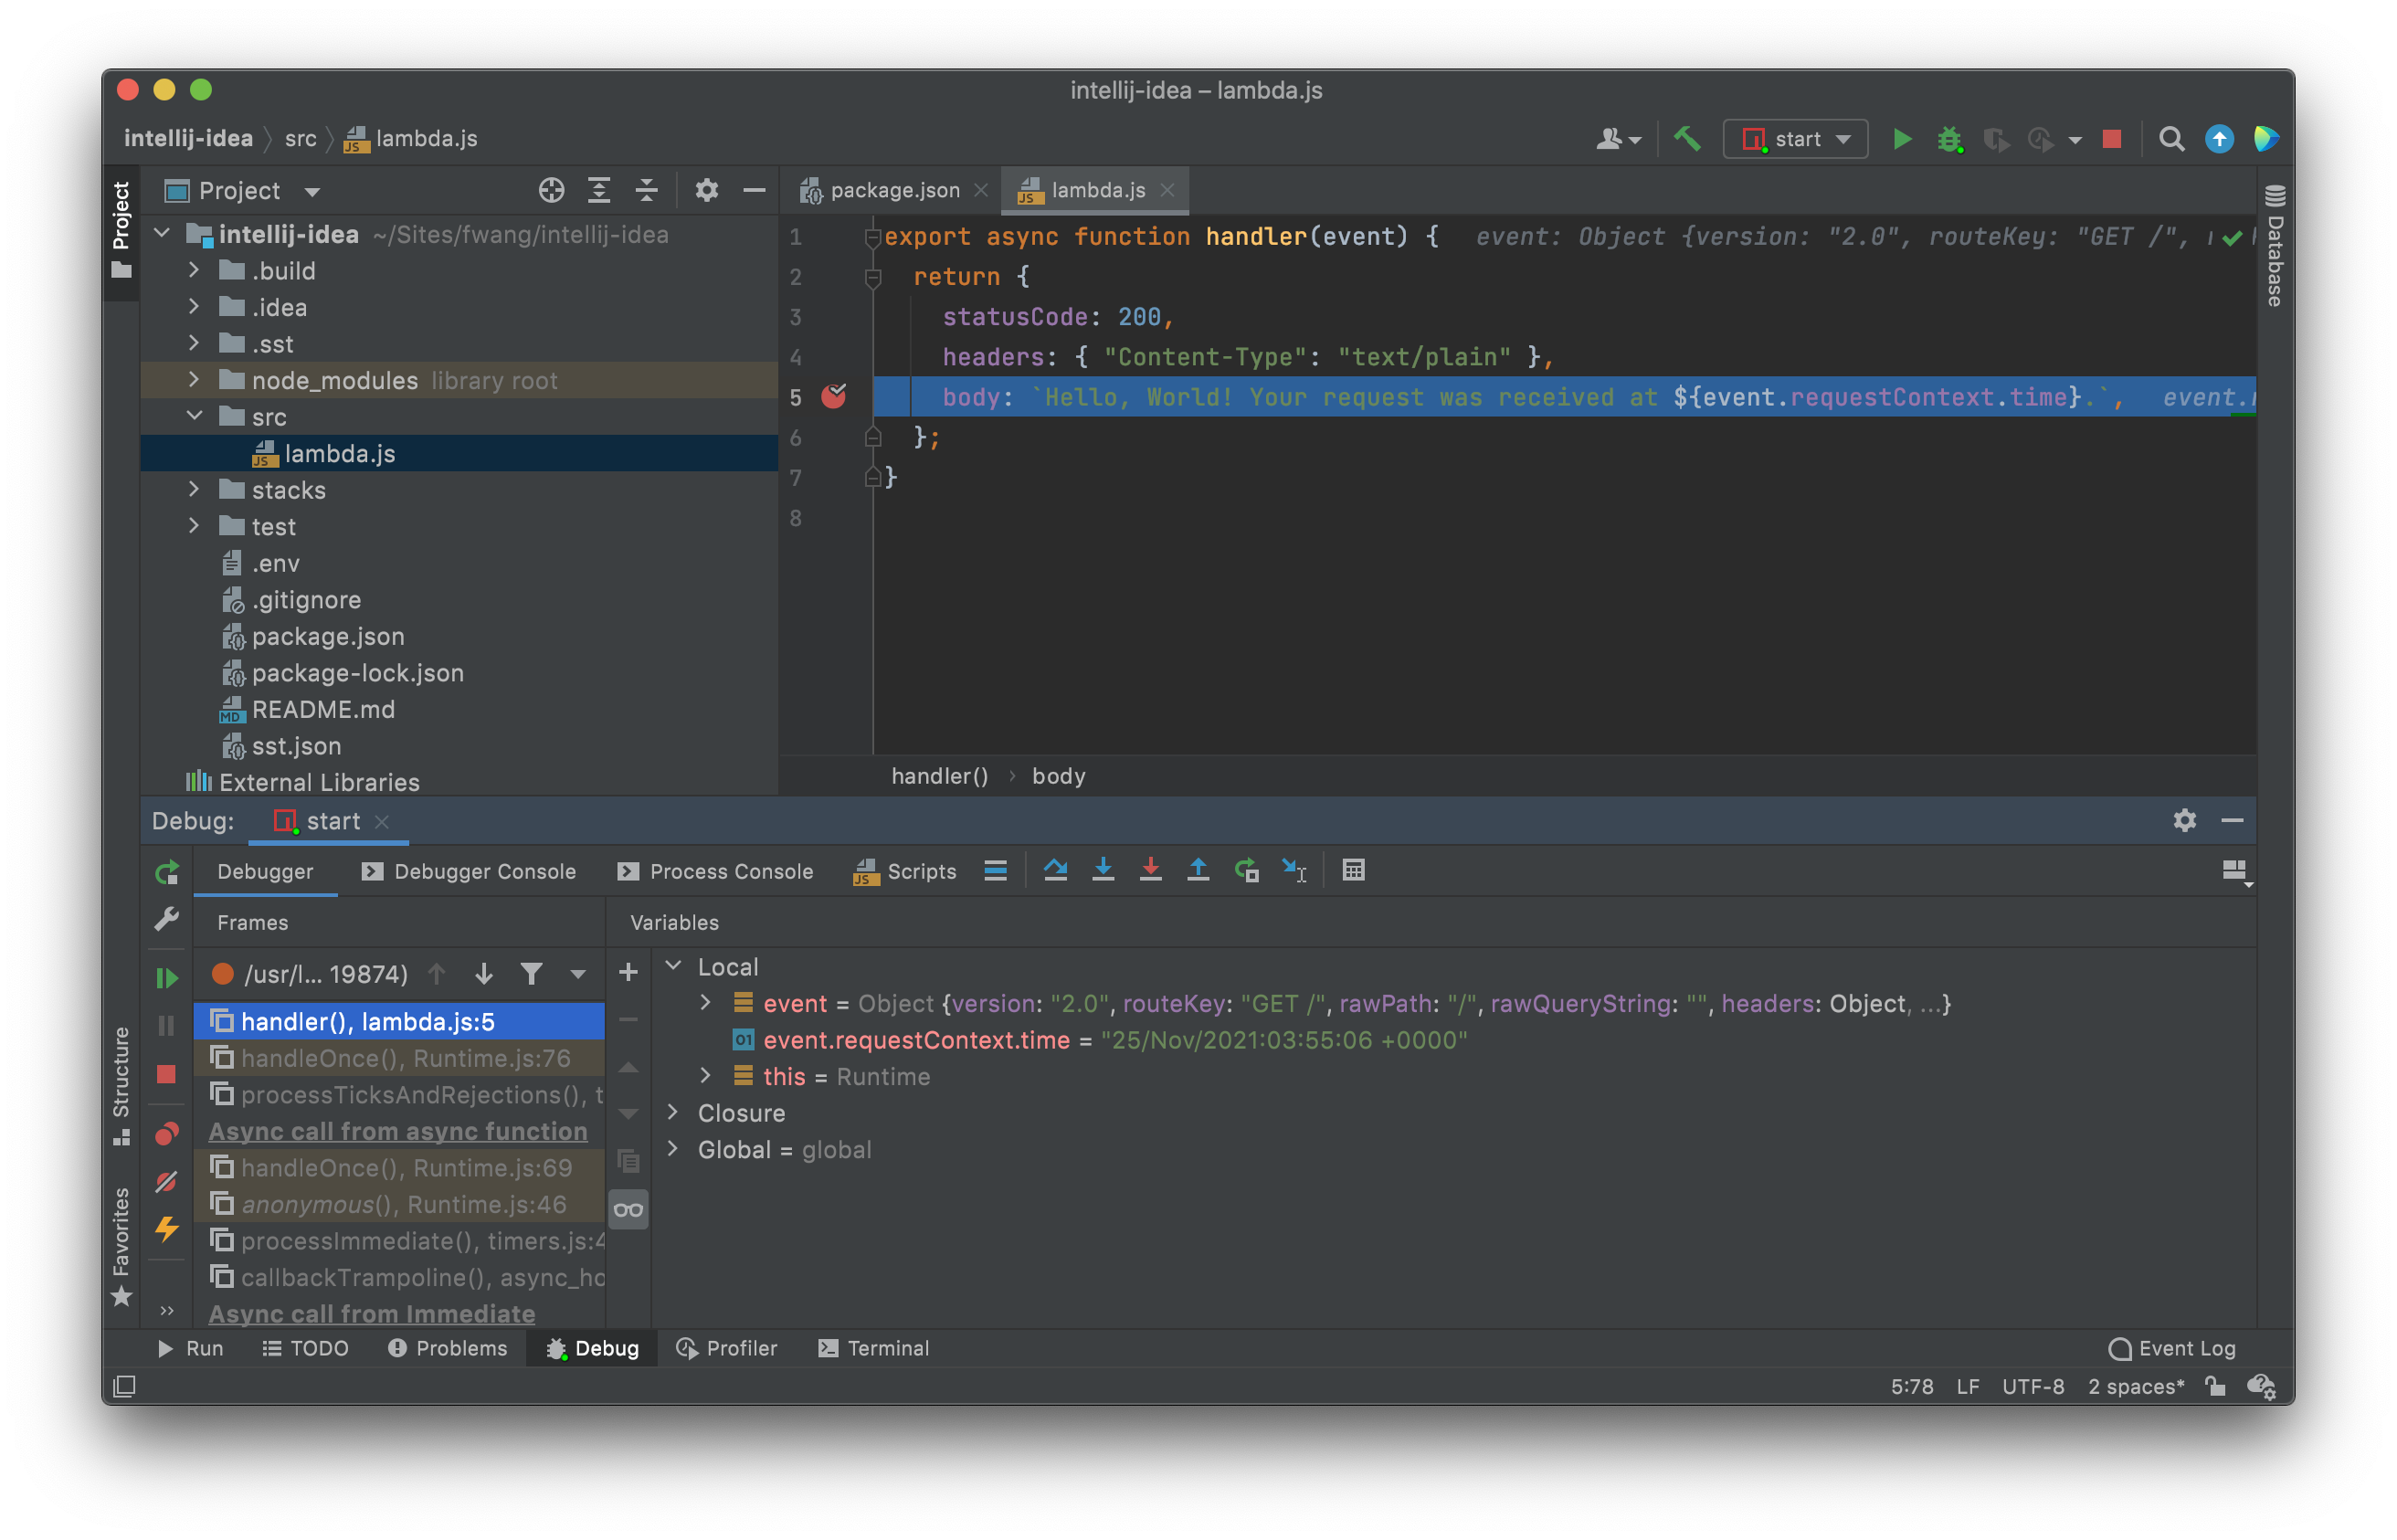
Now if you navigate to packages/functions/src/lambda.ts, you can set a breakpoint.
Click on Debug button to start the debugging
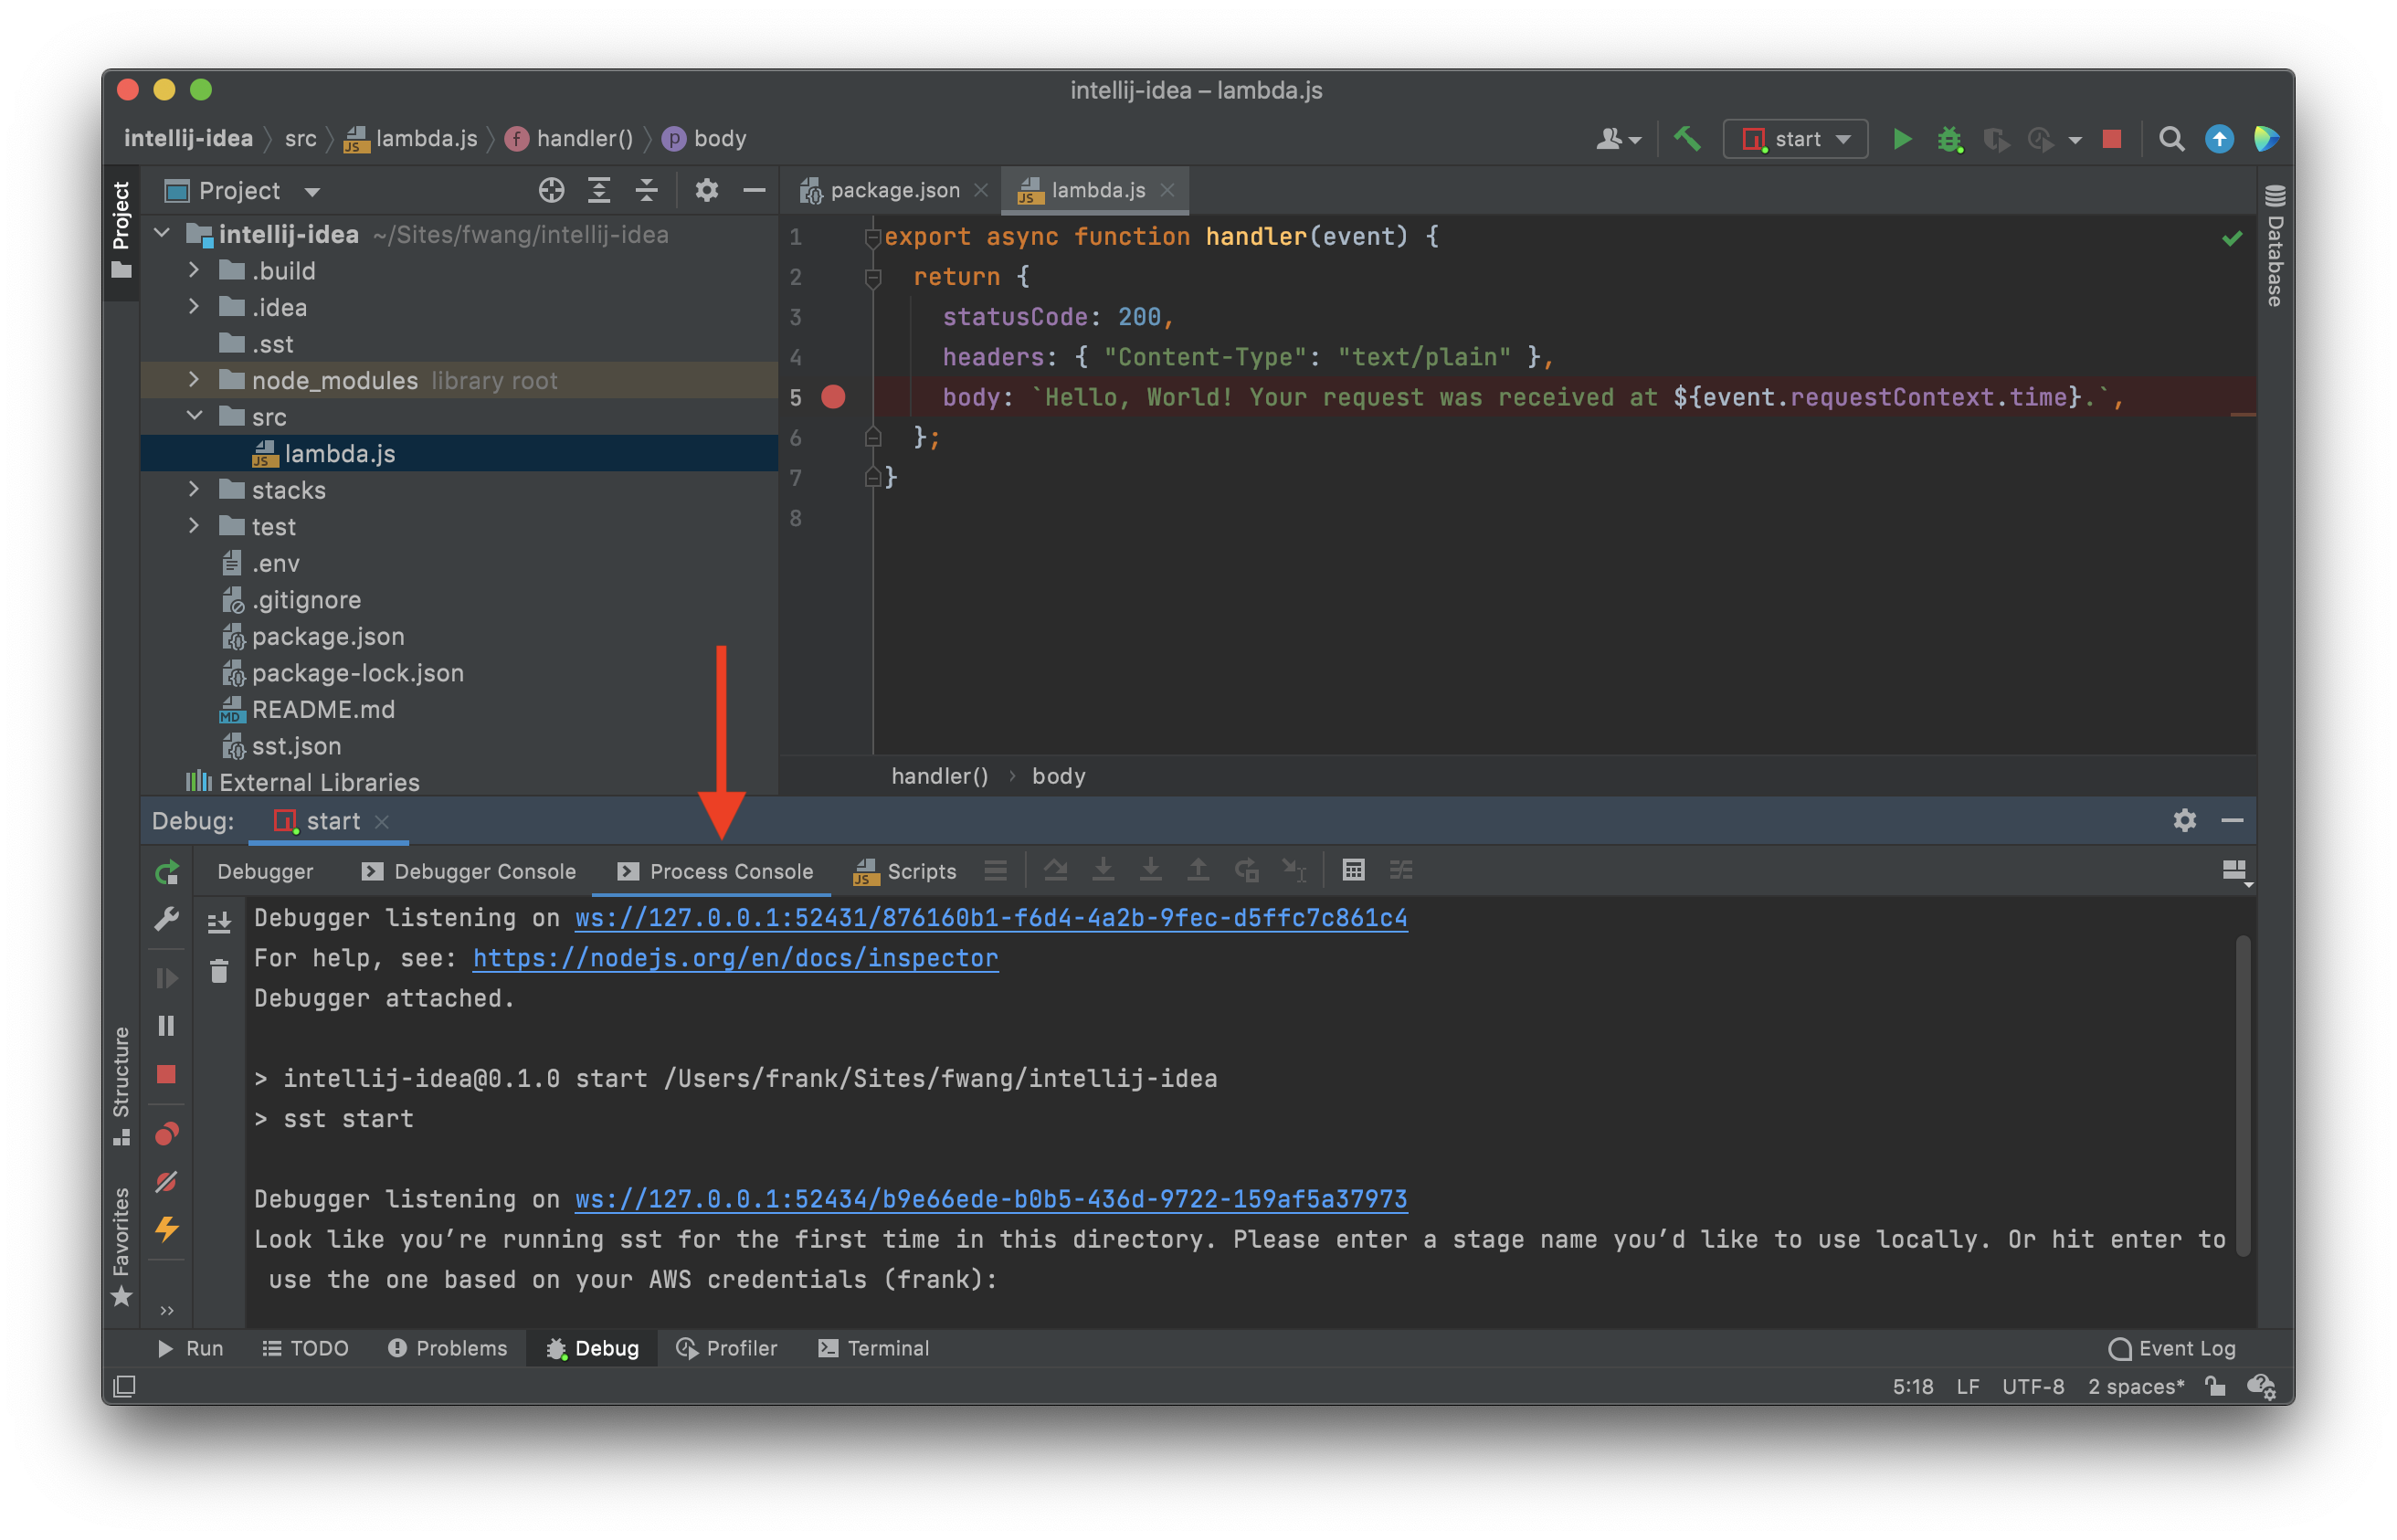
The first time you start the Live Lambda Development environment, you will be prompted to enter a stage name to use locally. If you are working within a team, it is recommended that you use a stage that’s specific to you. This ensures that you and your teammate can share an AWS account and still have standalone environments. Read more about this over on our docs.
Note that the prompt will be shown under the Process Console tab.
It’ll then take a couple of minutes to do the following:
- It’ll bootstrap your AWS environment to use CDK.
- Deploy a debug stack to power the Live Lambda Development environment.
- Deploy your app, but replace the functions in the
packages/functions/directory with ones that connect to your local client. - Start up a local client.
Once complete, you should see something like this.
===============
 Deploying app
===============

Preparing your SST app
Transpiling source
Linting source
Deploying stacks
dev-intellij-idea-ExampleStack: deploying...

 ✅  dev-intellij-idea-ExampleStack


Stack dev-intellij-idea-ExampleStack
  Status: deployed
  Outputs:
    ApiEndpoint: https://siyp617yh1.execute-api.us-east-1.amazonaws.com
The ApiEndpoint is the API we just created. Now if you head over to that endpoint in your browser, you’ll notice that you’ll hit the breakpoint.
Making changes
An advantage of using the Live Lambda Development environment is that you can make changes without having to redeploy them.
Replace packages/functions/src/lambda.ts with the following.
import { APIGatewayProxyHandlerV2 } from "aws-lambda";

export const handler: APIGatewayProxyHandlerV2 = async (event) => {
  return {
    statusCode: 200,
    headers: { "Content-Type": "text/plain" },
    body: `Hello, World! Your request was received at ${event.requestContext.time}.`,
  };
};
Now if you head back to the endpoint.
https://siyp617yh1.execute-api.us-east-1.amazonaws.com
You should see the new message being printed out.
Making improvements
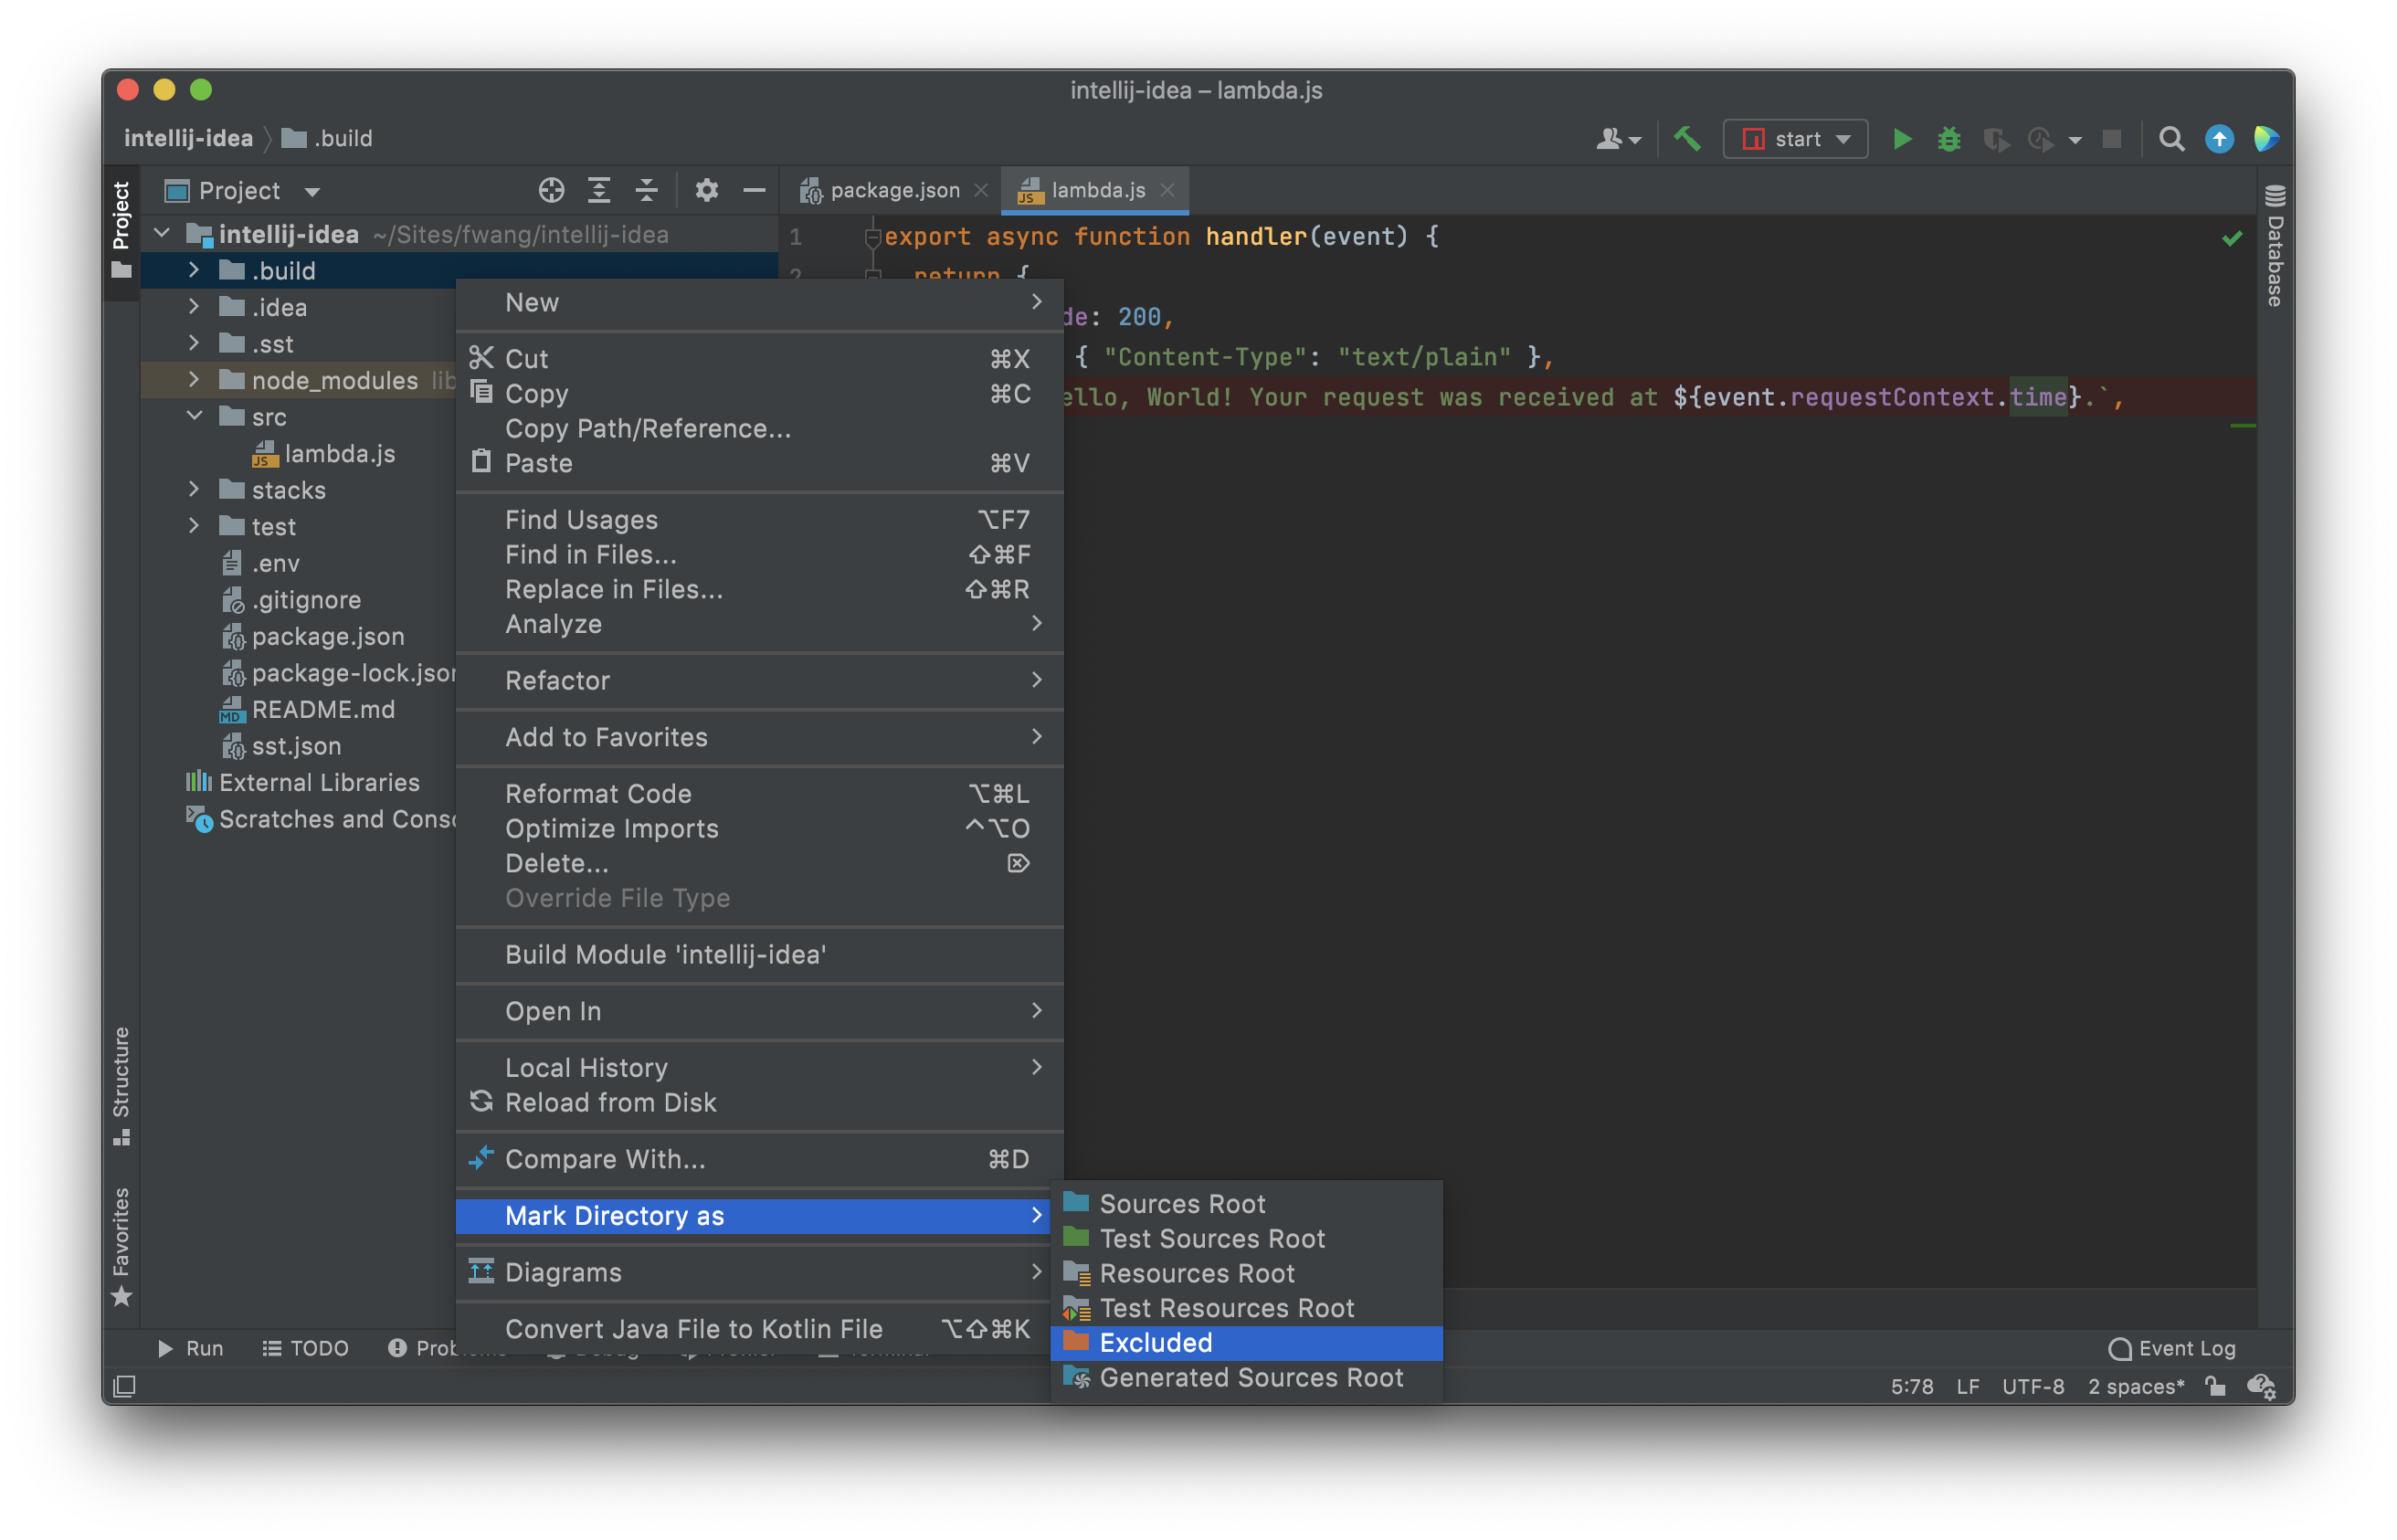
If you’re running into any memory issues while debugging, you can disable the unused plugins and exclude the folders that are not included in the source code. Right click on the folder and mark it as Excluded. In this case we are marking the node_modules/ directory as Excluded.
Deploying your API
Now that our API is tested and ready to go. Let’s go ahead and deploy it for our users. You’ll recall that we were using a dev environment.
However, we are going to deploy your API again. But to a different environment, called prod. This allows us to separate our environments, so when we are working in our local environment, it doesn’t break the API for our users.
Run the following in your terminal.
$ npx sst deploy --stage prod
A note on these environments. SST is simply deploying the same app twice using two different stage names. It prefixes the resources with the stage names to ensure that they don’t thrash.
Cleaning up
Finally, you can remove the resources created in this example using the following command.
$ npx sst remove
And to remove the prod environment.
$ npx sst remove --stage prod
Conclusion
And that’s it! You’ve got a brand new serverless API. A local development environment, to test and make changes. And you can use IntelliJ IDEA to debug and set breakpoints in your Lambda functions. Check out the repo below for the code we used in this example. And leave a comment if you have any questions!
Example repo for reference
github.com/sst/sst/tree/master/examples/intellij-ideaFor help and discussion
Comments on this exampleMore Examples
APIs
-
REST API
Building a simple REST API.
-
WebSocket API
Building a simple WebSocket API.
-
Go REST API
Building a REST API with Golang.
-
Custom Domains
Using a custom domain in an API.
Web Apps
-
React.js
Full-stack React app with a serverless API.
-
Next.js
Full-stack Next.js app with DynamoDB.
-
Vue.js
Full-stack Vue.js app with a serverless API.
-
Svelte
Full-stack SvelteKit app with a serverless API.
-
Gatsby
Full-stack Gatsby app with a serverless API.
-
Angular
Full-stack Angular app with a serverless API.
Mobile Apps
GraphQL
Databases
-
DynamoDB
Using DynamoDB in a serverless API.
-
MongoDB Atlas
Using MongoDB Atlas in a serverless API.
-
PostgreSQL
Using PostgreSQL and Aurora in a serverless API.
-
CRUD DynamoDB
Building a CRUD API with DynamoDB.
-
PlanetScale
Using PlanetScale in a serverless API.
Authentication
Using SST Auth
-
Facebook Auth
Adding Facebook auth to a full-stack serverless app.
-
Google Auth
Adding Google auth to a full-stack serverless app.
Using Cognito Identity Pools
-
Cognito IAM
Authenticating with Cognito User Pool and Identity Pool.
-
Facebook Auth
Authenticating a serverless API with Facebook.
-
Twitter Auth
Authenticating a serverless API with Twitter.
-
Auth0 IAM
Authenticating a serverless API with Auth0.
Using Cognito User Pools
-
Cognito JWT
Adding JWT authentication with Cognito.
-
Auth0 JWT
Adding JWT authentication with Auth0.
-
Google Auth
Authenticating a full-stack serverless app with Google.
-
GitHub Auth
Authenticating a full-stack serverless app with GitHub.
-
Facebook Auth
Authenticating a full-stack serverless app with Facebook.
Async Tasks
-
Cron
A simple serverless Cron job.
-
Queues
A simple queue system with SQS.
-
Pub/Sub
A simple pub/sub system with SNS.
-
Resize Images
Automatically resize images uploaded to S3.
-
Kinesis data streams
A simple Kinesis Data Stream system.
-
EventBus
A simple EventBridge system with EventBus.
Editors
-
Debug With VS Code
Using VS Code to debug serverless apps.
-
Debug With WebStorm
Using WebStorm to debug serverless apps.
Monitoring
Miscellaneous
-
Lambda Layers
Using the @sparticuz/chromium layer to take screenshots.
-
Middy Validator
Use Middy to validate API request and responses.