


How to use Thundra APM to monitor your serverless app
In this example we will look at how to use Thundra APM to monitor the Lambda functions in your SST serverless application.
Requirements
- Node.js 16 or later
- We’ll be using TypeScript
- An AWS account with the AWS CLI configured locally
- A Thundra account and that’s it.
What is Thundra
When a serverless app is deployed to production, it’s useful to be able to monitor your Lambda functions. There are a few different services that you can use for this. One of them is Thundra. Thundra offers an End-to-end Serverless Monitoring solution called Thundra APM that works with Lambda functions.
Let’s look at how to set this up.
Create an SST app
 Start by creating an SST app.
$ npx create-sst@latest --template=base/example thundra
$ cd thundra
$ npm install
By default, our app will be deployed to the us-east-1 AWS region. This can be changed in the sst.config.ts in your project root.
import { SSTConfig } from "sst";

export default {
  config(_input) {
    return {
      name: "thundra",
      region: "us-east-1",
    };
  },
} satisfies SSTConfig;
Project layout
An SST app is made up of a couple of parts.
-
stacks/— App InfrastructureThe code that describes the infrastructure of your serverless app is placed in the
stacks/directory of your project. SST uses AWS CDK, to create the infrastructure. -
packages/functions/— App CodeThe code that’s run when your API is invoked is placed in the
packages/functions/directory of your project.
Create our infrastructure
Our app is going to be a simple API that returns a Hello World response.
Creating our API
Let’s add the API.
Replace the stacks/ExampleStack.ts with the following.
import { StackContext, Api } from "sst/constructs";

export function ExampleStack({ stack, app }: StackContext) {
  // Create a HTTP API
  const api = new Api(stack, "Api", {
    routes: {
      "GET /": "packages/functions/src/lambda.handler",
    },
  });

  // Show the endpoint in the output
  stack.addOutputs({
    ApiEndpoint: api.url,
  });
}
We are using the SST Api construct to create our API. It simply has one endpoint at the root. When we make a GET request to this endpoint the function called handler in packages/functions/src/lambda.ts will get invoked.
Your packages/functions/src/lambda.ts should look something like this.
import { APIGatewayProxyHandlerV2 } from "aws-lambda";

export const handler: APIGatewayProxyHandlerV2 = async (event) => {
  return {
    statusCode: 200,
    headers: { "Content-Type": "text/plain" },
    body: `Hello, World! Your request was received`,
  };
};
Setting up our app with Thundra
Thundra offers Thundra APM - Application Performance Monitoring for Serverless and Containers.
To get started, sign up for an account in Thundra.
Next, go to the Projects page of your Thundra dashboard and copy the API key.
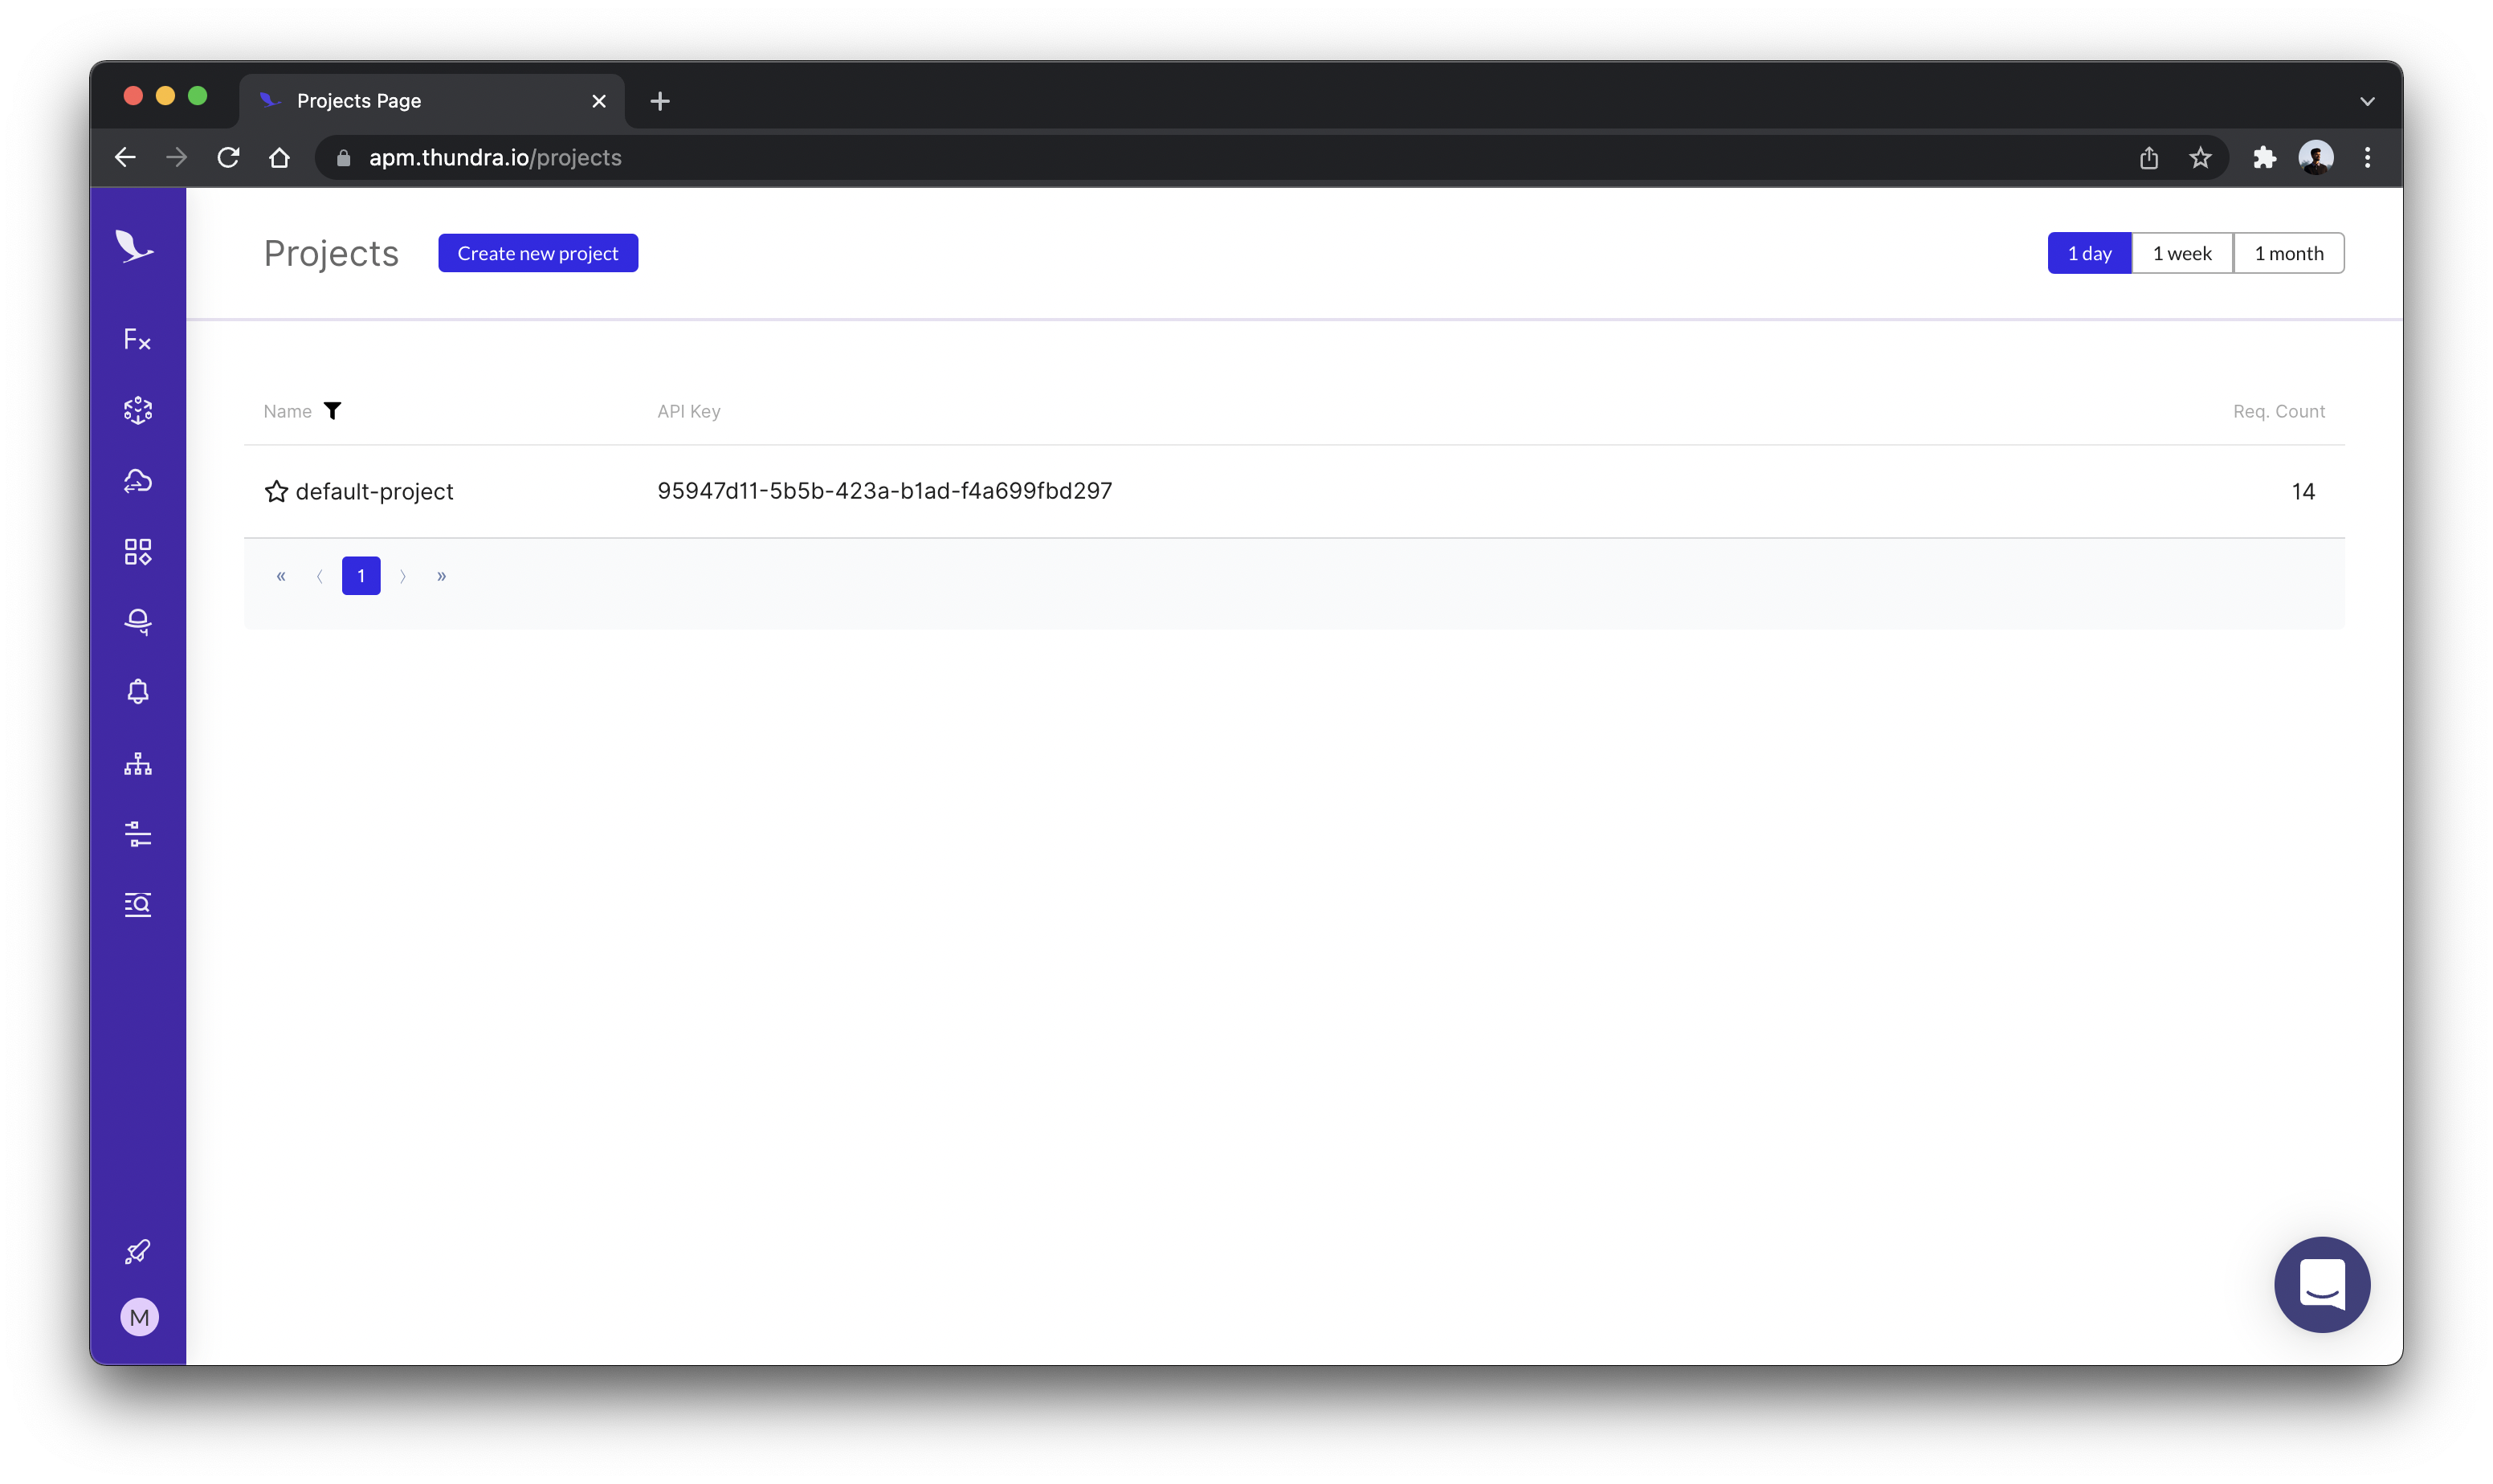
Create a .env.local file with the API key in your project root.
THUNDRA_APIKEY=<API_KEY>
Note that, this file should not be committed to Git. If you are deploying the app through a CI service, configure the THUNDRA_APIKEY as an environment variable in the CI provider. If you are deploying through Seed, you can configure this in your stage settings.
You can connect to Thundra in two ways,
- You can connect your AWS account and add our CloudFormation stack into your AWS.
- If you don’t want to give access to your AWS account, you can always manually instrument your application to monitor with Thundra. Thundra supports different types of languages, platforms, web frameworks, and applications. You can learn more about connecting Thundra here.
For this tutorial let’s follow the second way.
You can then set the layer for all the functions in your stack using the addDefaultFunctionLayers and addDefaultFunctionEnv. Note we only want to enable this when the function is deployed, and not when using Live Lambda Dev.
Add the following above the api definiton line in stacks/ExampleStack.ts.
// Configure thundra to only prod
if (!app.local) {
  const thundraAWSAccountNo = 269863060030;
  const thundraNodeLayerVersion = 107; // Latest version at time of writing
  const thundraLayer = LayerVersion.fromLayerVersionArn(
    this,
    "ThundraLayer",
    `arn:aws:lambda:${app.region}:${thundraAWSAccountNo}:layer:thundra-lambda-node-layer:${thundraNodeLayerVersion}`
  );
  stack.addDefaultFunctionLayers([thundraLayer]);

  stack.addDefaultFunctionEnv({
    THUNDRA_APIKEY: process.env.THUNDRA_APIKEY,
    NODE_OPTIONS: "-r @thundra/core/dist/bootstrap/lambda",
  });
}
Note, to figure out the layer ARN for the latest version, check the badge here.
Note that addDefaultFunctionLayers and addDefaultFunctionEnv only affects the functions added after it’s been called. So make sure to call it at the beginning of your stack definition if you want to monitor all the Lambda functions in your stack.
Deploying to prod
To wrap things up we’ll deploy our app to prod.
$ npx sst deploy --stage prod
This allows us to separate our environments, so when we are working in dev, it doesn’t break the app for our users.
Once deployed, you should see something like this.
 ✅  prod-thundra-ExampleStack


Stack prod-thundra-ExampleStack
  Status: deployed
  Outputs:
    ApiEndpoint: https://k40qchmtvf.execute-api.ap-south-1.amazonaws.com
The ApiEndpoint is the API we just created.
Let’s test our endpoint using the integrated SST Console. The SST Console is a web based dashboard to manage your SST apps Learn more about it in our docs.
Run the below command to start SST console in prod stage.
npx sst console --stage prod
Go to the API tab and click the Send button.
Note, The API explorer lets you make HTTP requests to any of the routes in your Api construct. Set the headers, query params, request body, and view the function logs with the response.
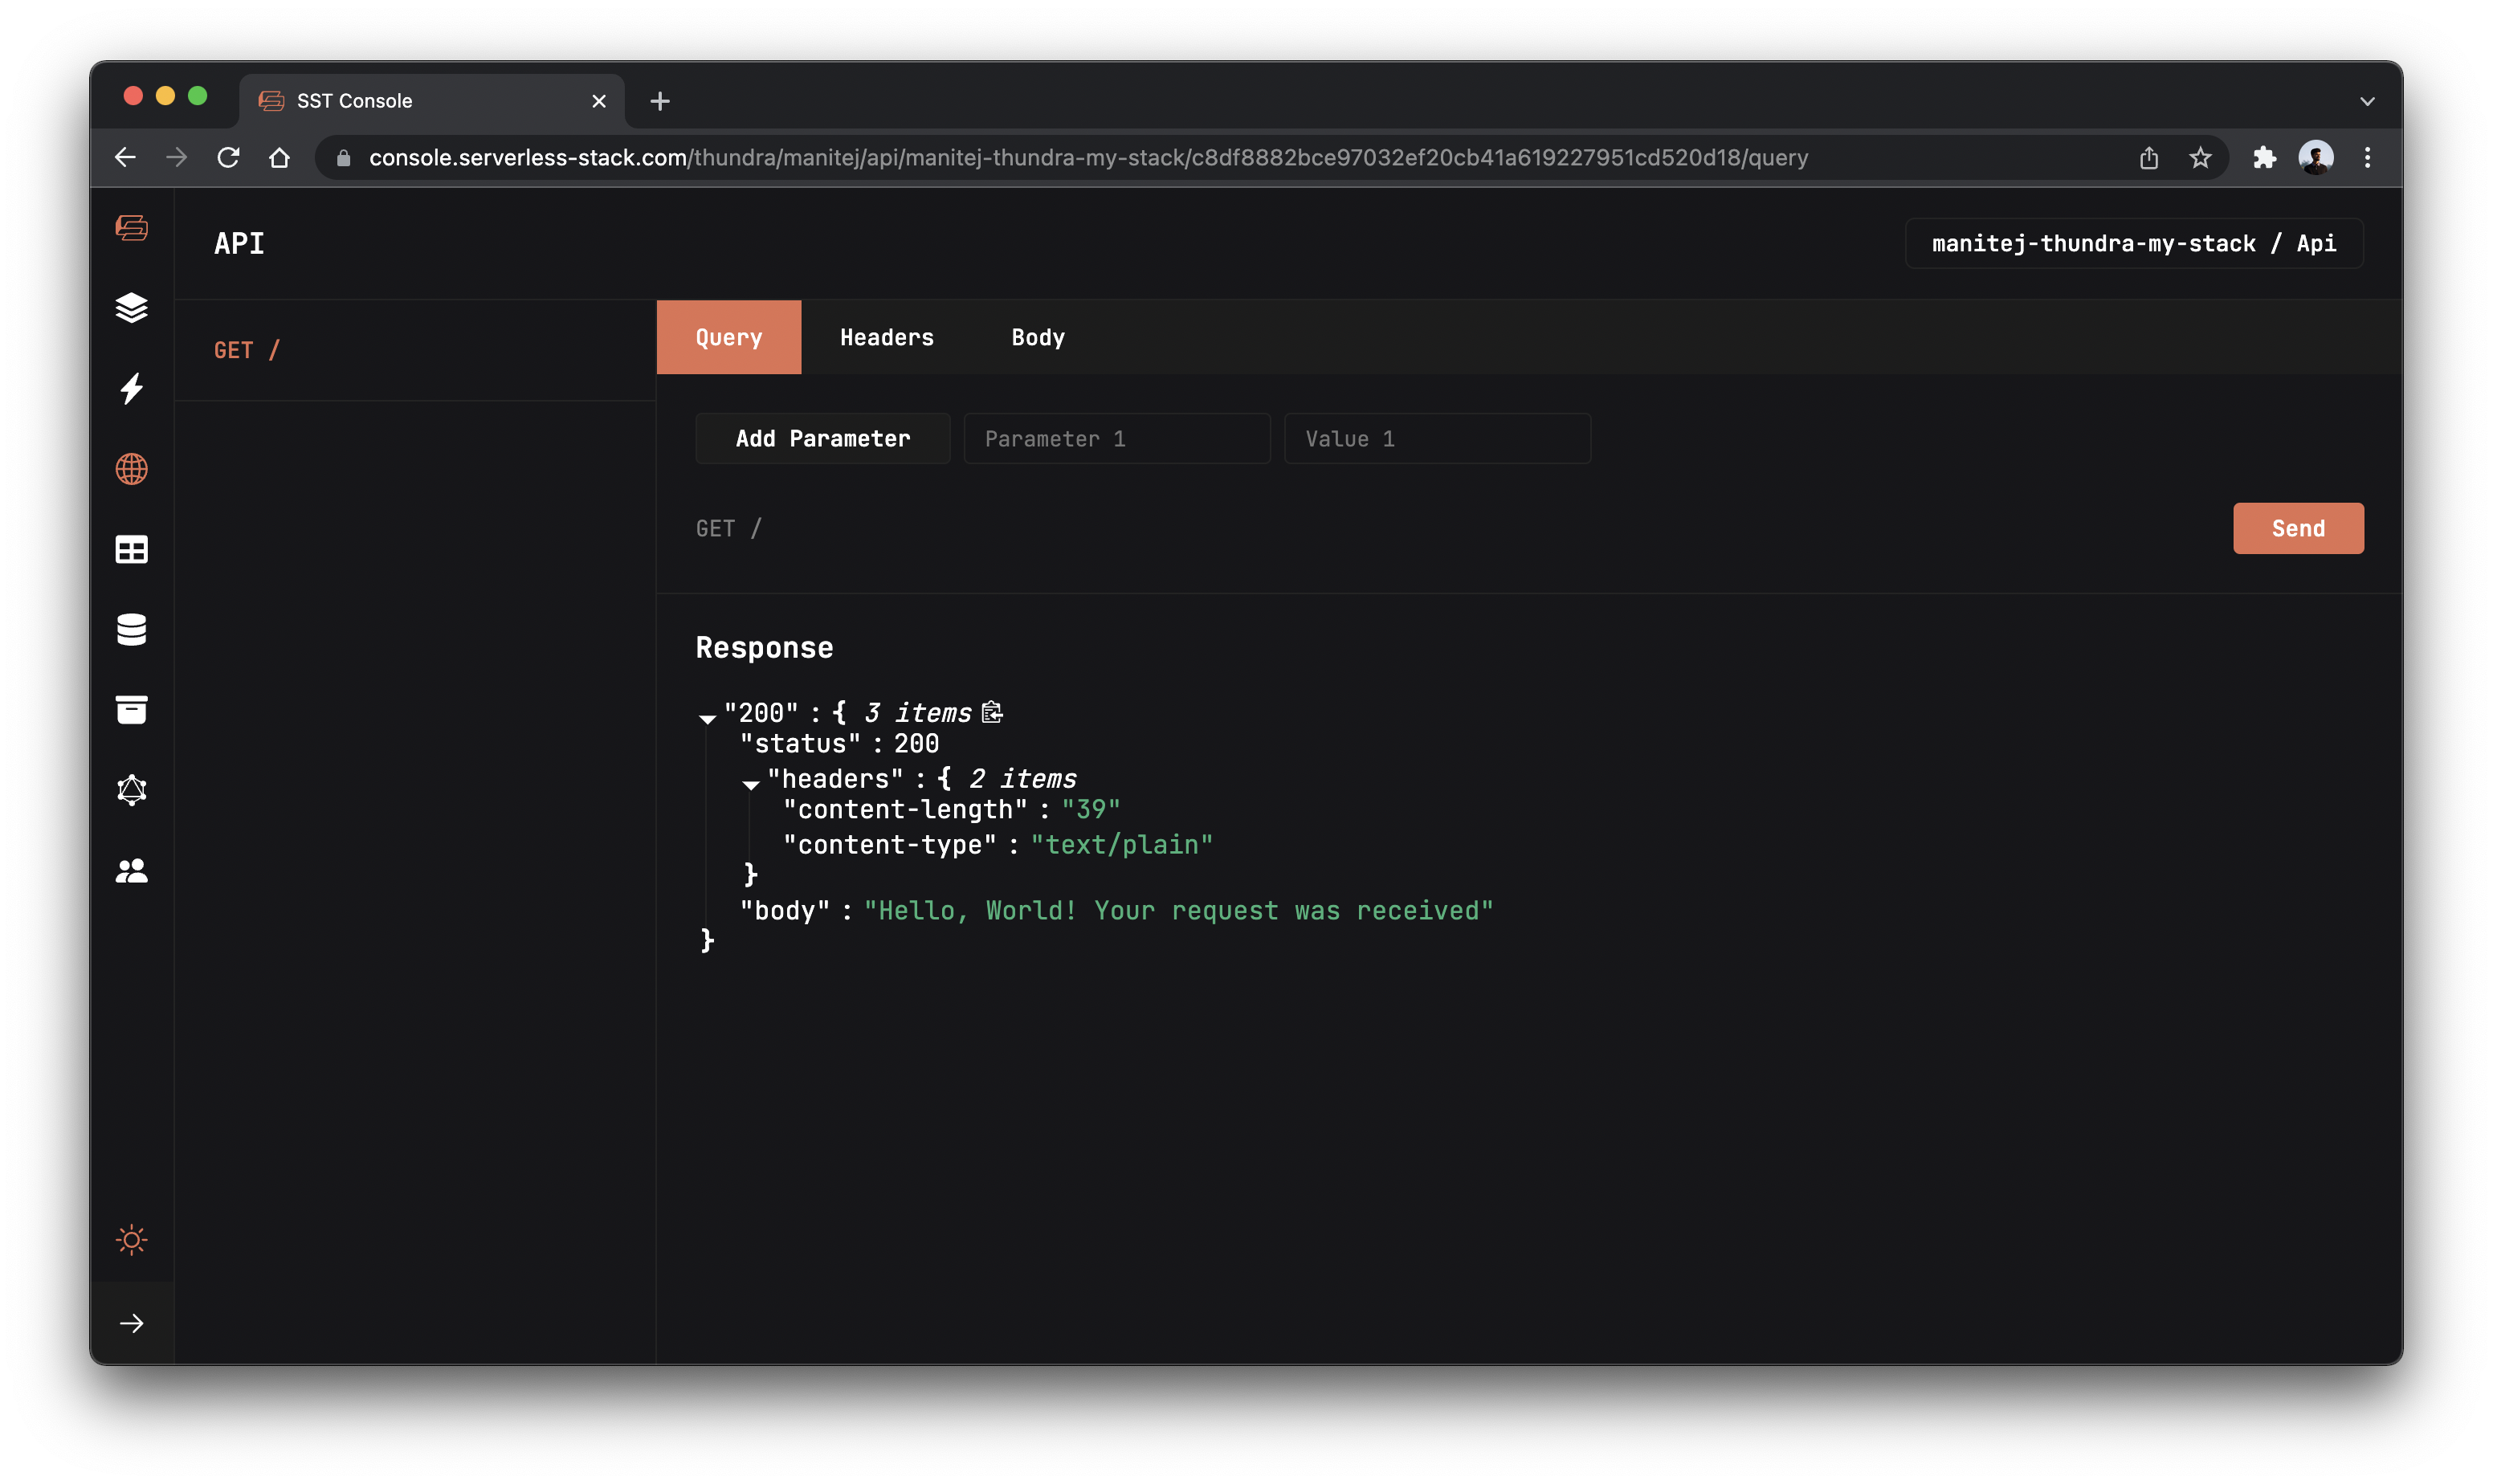
You will see the response of your function.
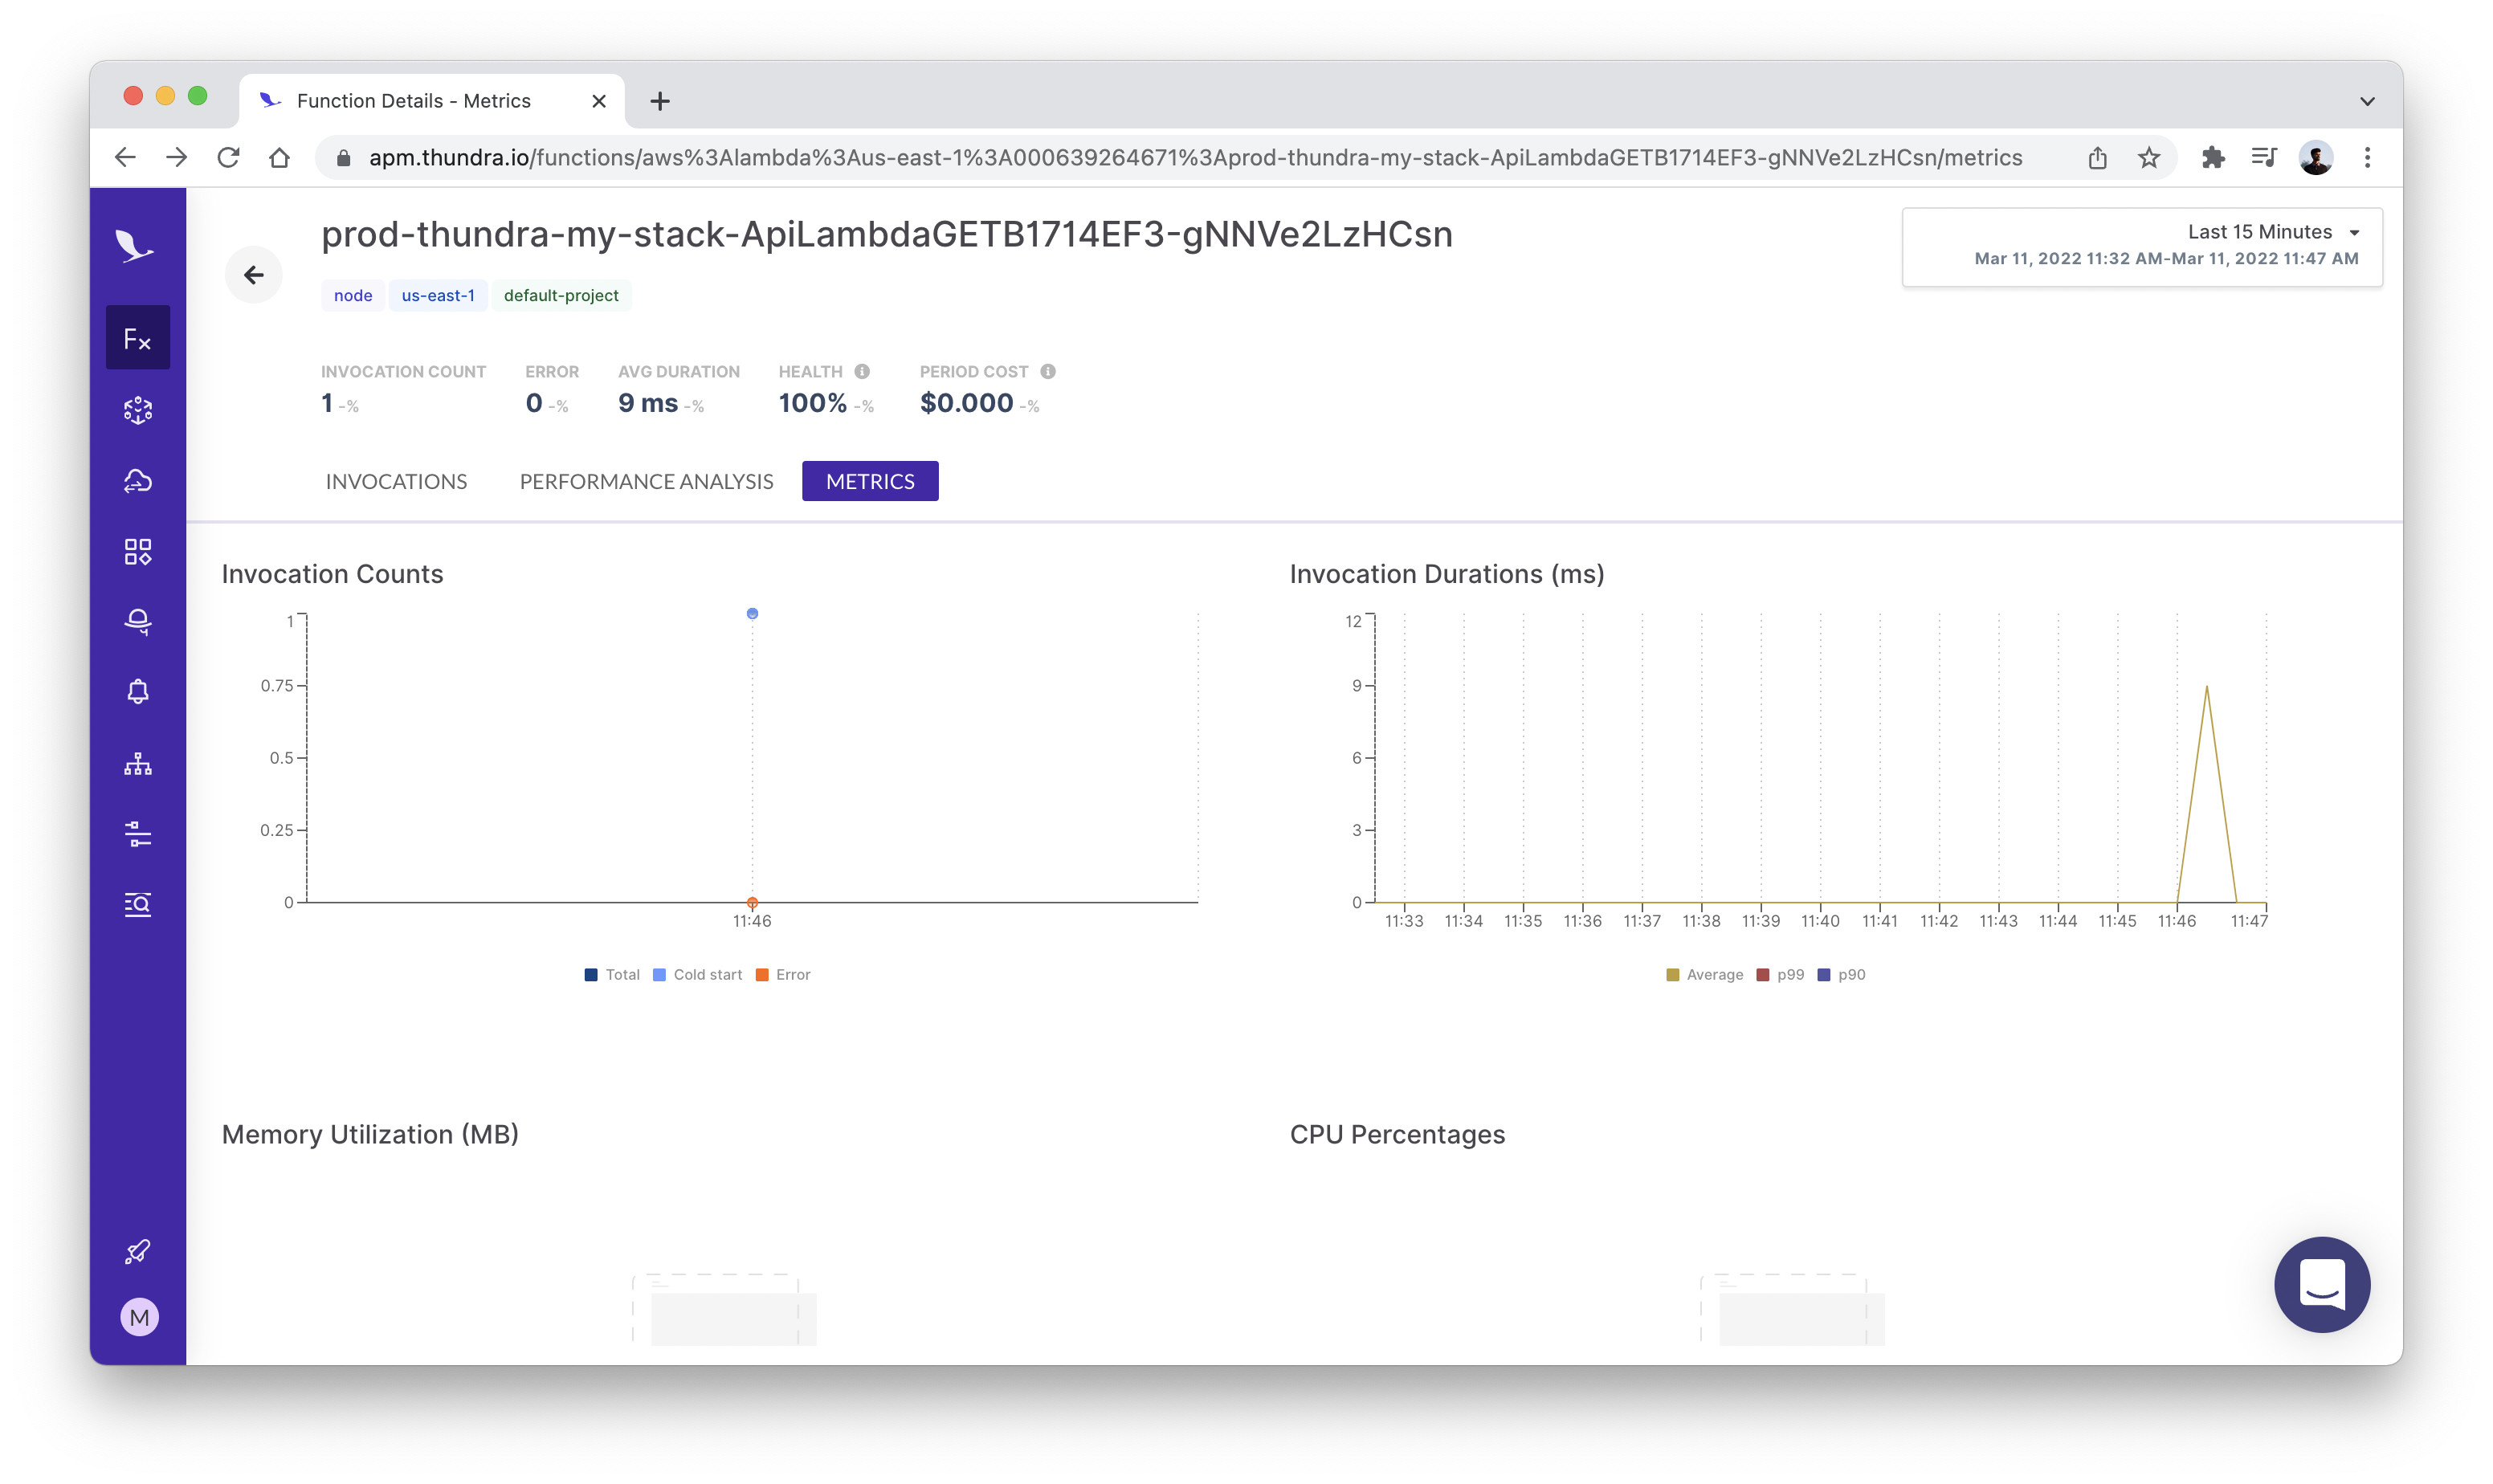
Now let’s go to Thundra dashboard to check if we are able to monitor the invocation.
The Functions view aggregates data from all of the serverless functions running in your environment, enabling you to monitor their performance in one place.
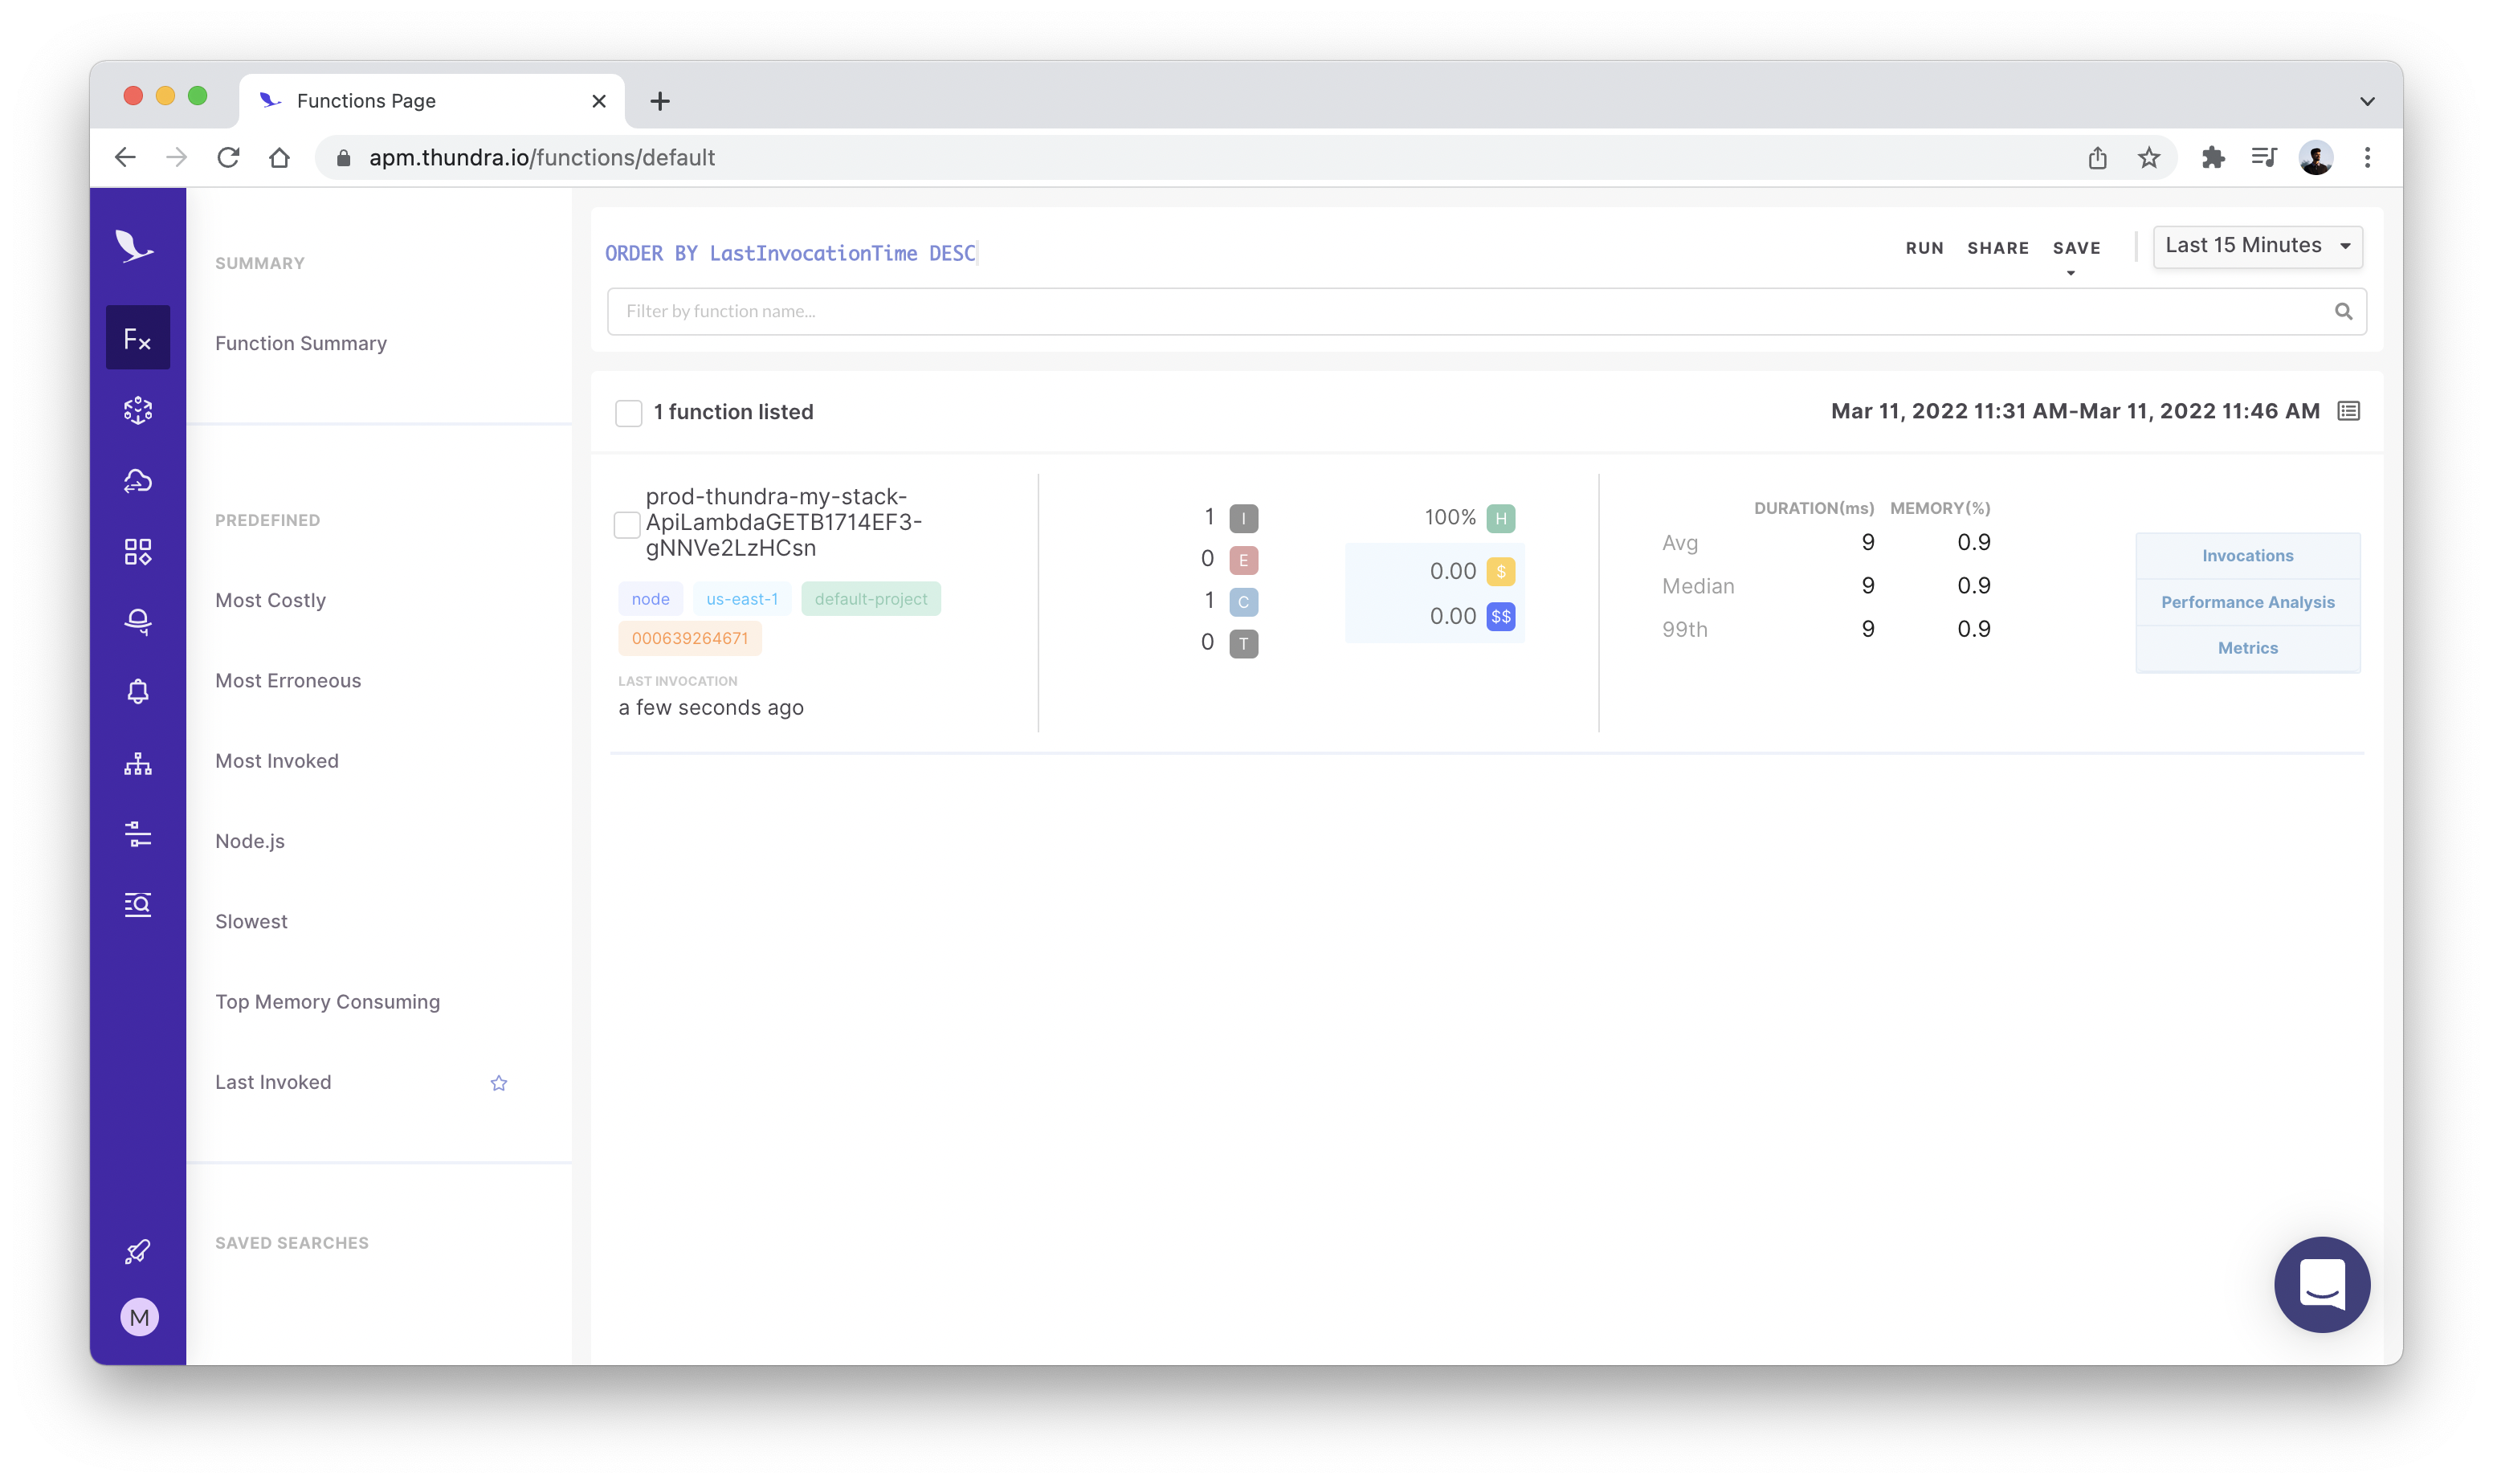
Note, you may need to wait for 5-10 minutes before you can see the metrics of your function.
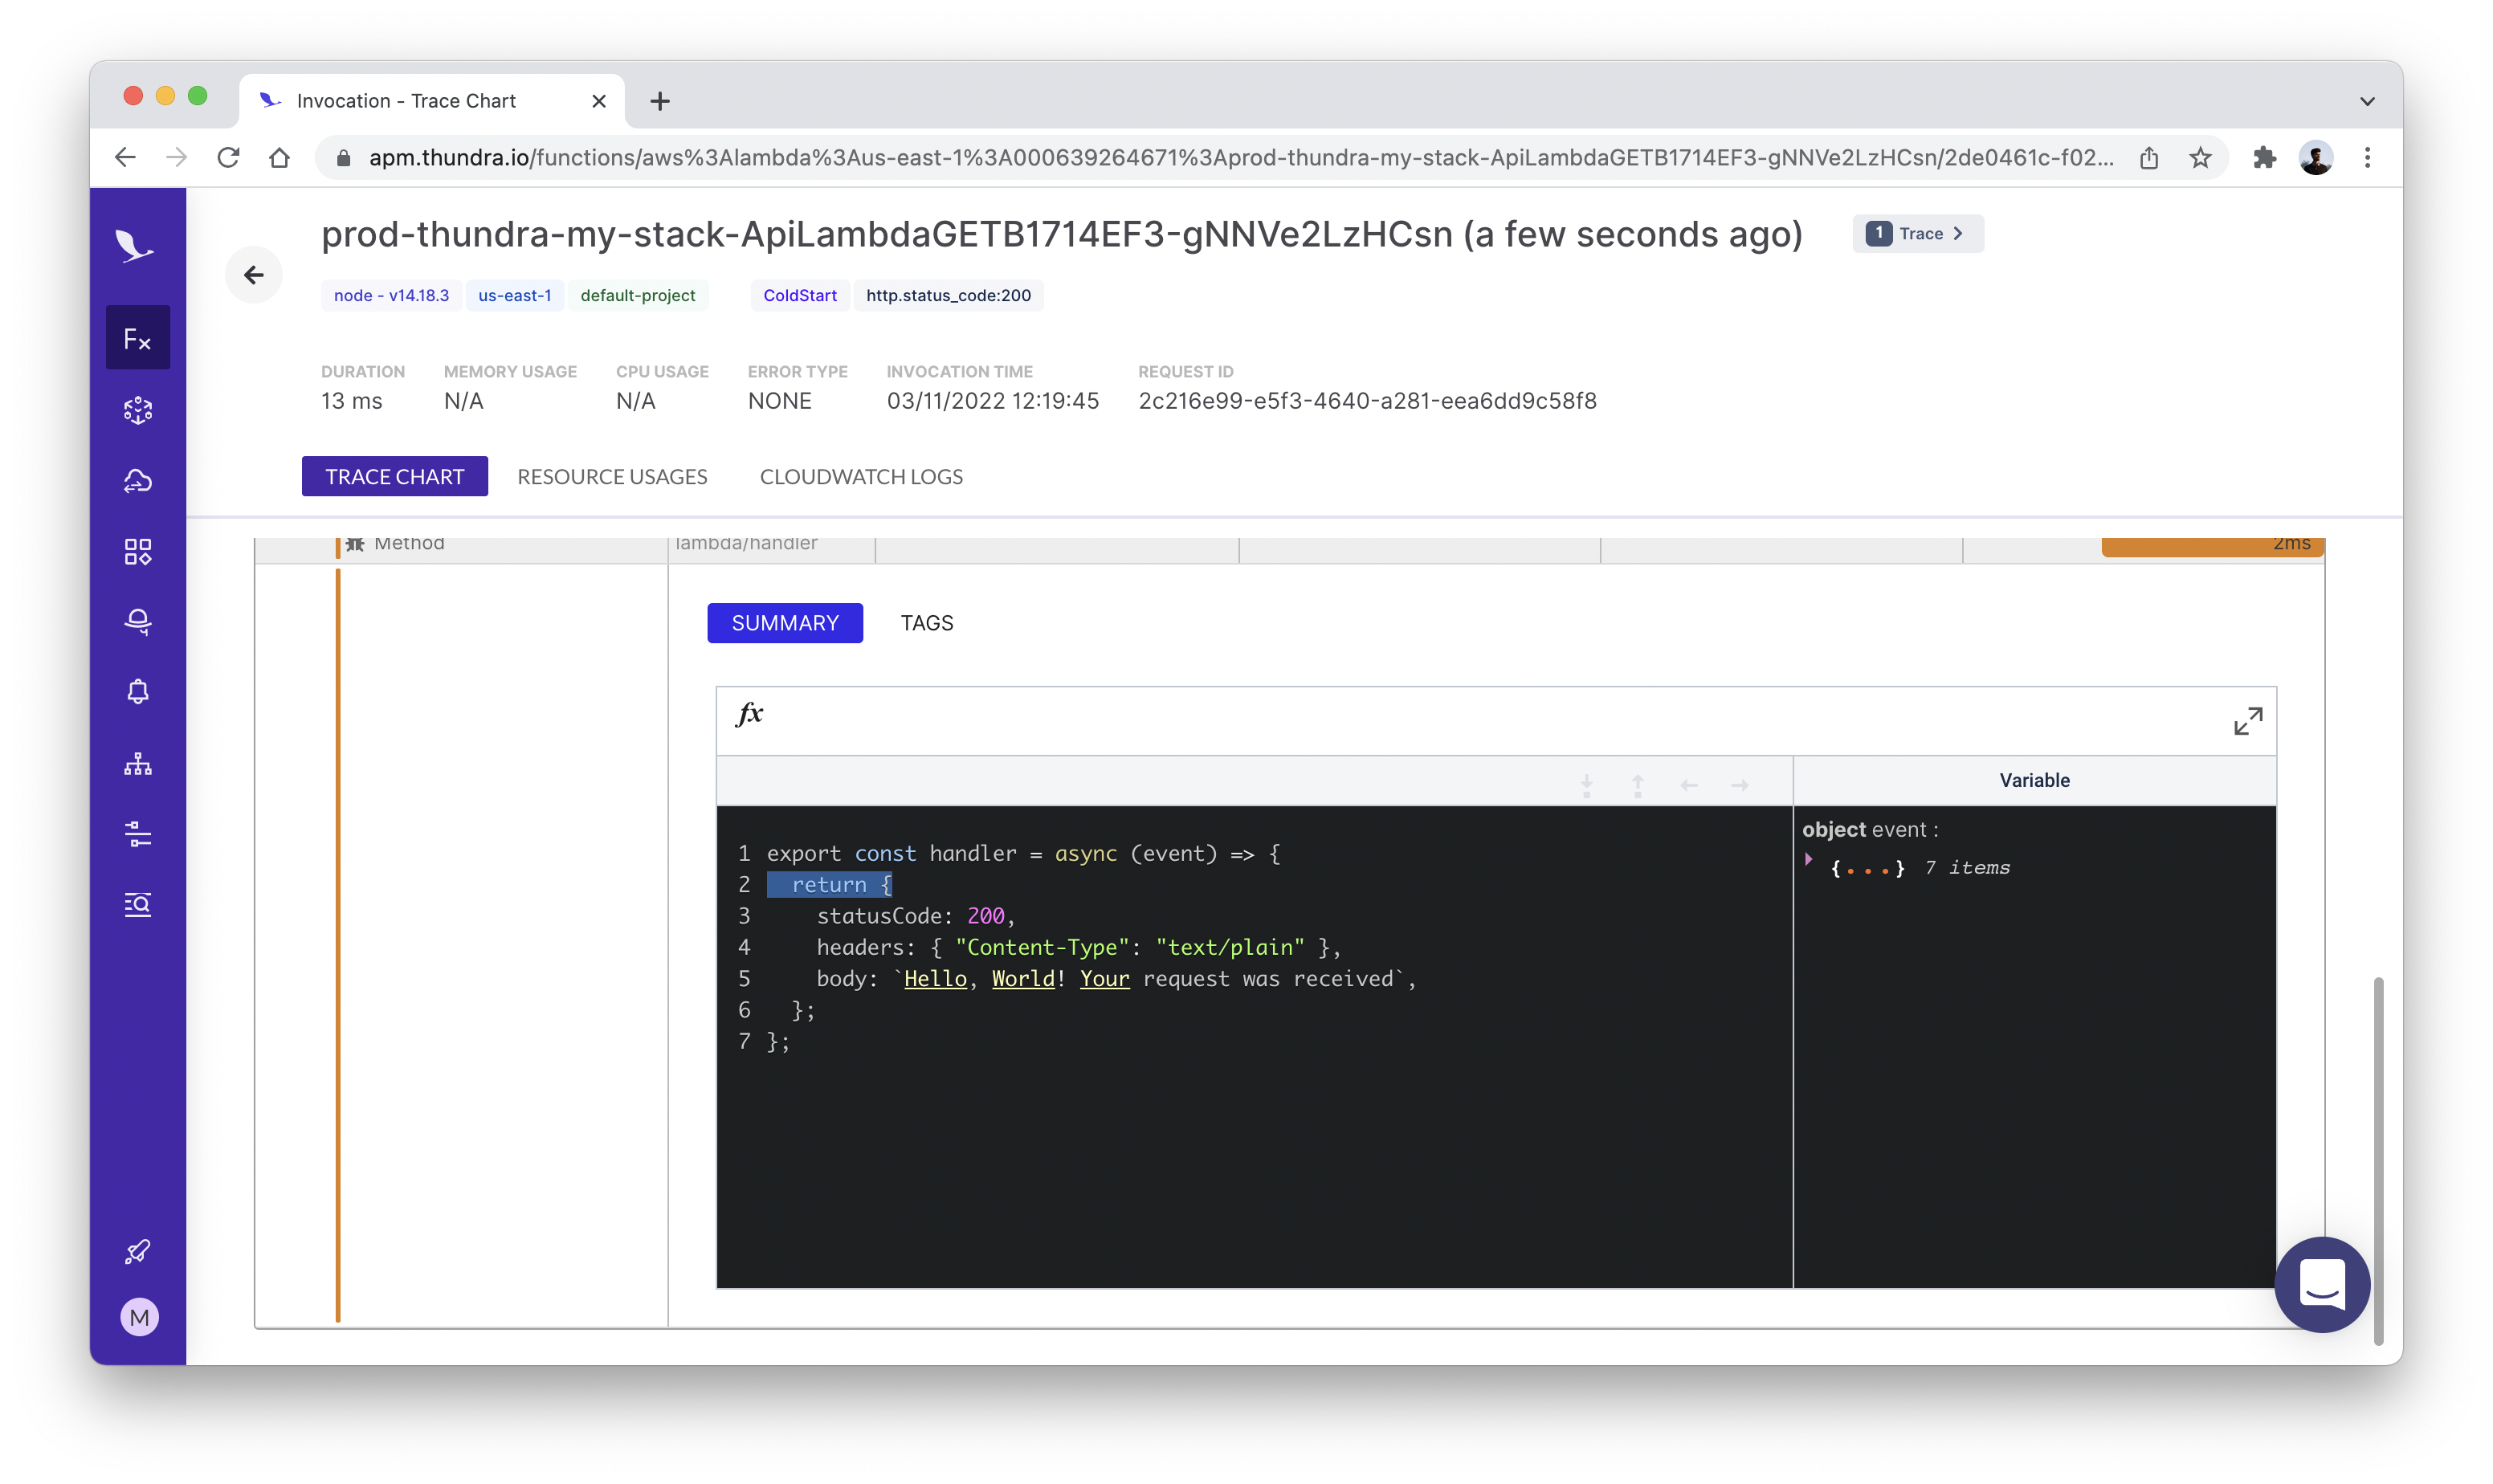
Time Travel Debugging
Thudra also offers a feature called Time Travel Debugging (TTD) that makes it possible to travel back in time to previous states of your application by getting a snapshot of when each line is executed. You can step over each line of the code and track the values of the variables captured during execution.
To enable TTD in your SST app, follow the below steps.
If you use SST and your code is bundled, you can use thundra-esbuild-plugin to activate TTD (Time-Travel Debugging).
Install the package by running below command in the packages/functions/ folder.
npm install --save-dev @thundra/esbuild-plugin
Create a new file called esbuild.js inside config folder in root and add the below code.
// config/esbuild.js

/* eslint-disable @typescript-eslint/no-var-requires */
const { ThundraEsbuildPlugin } = require("@thundra/esbuild-plugin");

module.exports = [
  ThundraEsbuildPlugin({
    traceableConfigs: [
      "src.*.*[traceLineByLine=true]", // activate line by line tracing for all files/methods under src folder
    ],
  }),
];
And then in stacks/ExampleStack.ts add the below code under the defaults in Api construct.
Replace the following in stacks/ExampleStack.ts:
const api = new Api(stack, "Api", {
  routes: {
    "GET /": "packages/functions/src/lambda.handler",
  },
});
With:
const api = new Api(stack, "Api", {
  defaults: {
    function: {
      bundle: {
        esbuildConfig: {
          plugins: "config/esbuild.js",
        },
      },
    },
  },
  routes: {
    "GET /": "packages/functions/src/lambda.handler",
  },
});
Now in the Trace chart of the invocation you can see the code that is executed.
Cleaning up
Finally, you can remove the resources created in this example using the following commands.
$ npx sst remove
$ npx sst remove --stage prod
Conclusion
And that’s it! We’ve got a serverless API monitored with Thundra. We also have a local development environment, to test and make changes. And it’s deployed to production as well, so you can share it with your users. Check out the repo below for the code we used in this example. And leave a comment if you have any questions!
Example repo for reference
github.com/sst/sst/tree/master/examples/thundraFor help and discussion
Comments on this exampleMore Examples
APIs
-
REST API
Building a simple REST API.
-
WebSocket API
Building a simple WebSocket API.
-
Go REST API
Building a REST API with Golang.
-
Custom Domains
Using a custom domain in an API.
Web Apps
-
React.js
Full-stack React app with a serverless API.
-
Next.js
Full-stack Next.js app with DynamoDB.
-
Vue.js
Full-stack Vue.js app with a serverless API.
-
Svelte
Full-stack SvelteKit app with a serverless API.
-
Gatsby
Full-stack Gatsby app with a serverless API.
-
Angular
Full-stack Angular app with a serverless API.
Mobile Apps
GraphQL
Databases
-
DynamoDB
Using DynamoDB in a serverless API.
-
MongoDB Atlas
Using MongoDB Atlas in a serverless API.
-
PostgreSQL
Using PostgreSQL and Aurora in a serverless API.
-
CRUD DynamoDB
Building a CRUD API with DynamoDB.
-
PlanetScale
Using PlanetScale in a serverless API.
Authentication
Using SST Auth
-
Facebook Auth
Adding Facebook auth to a full-stack serverless app.
-
Google Auth
Adding Google auth to a full-stack serverless app.
Using Cognito Identity Pools
-
Cognito IAM
Authenticating with Cognito User Pool and Identity Pool.
-
Facebook Auth
Authenticating a serverless API with Facebook.
-
Twitter Auth
Authenticating a serverless API with Twitter.
-
Auth0 IAM
Authenticating a serverless API with Auth0.
Using Cognito User Pools
-
Cognito JWT
Adding JWT authentication with Cognito.
-
Auth0 JWT
Adding JWT authentication with Auth0.
-
Google Auth
Authenticating a full-stack serverless app with Google.
-
GitHub Auth
Authenticating a full-stack serverless app with GitHub.
-
Facebook Auth
Authenticating a full-stack serverless app with Facebook.
Async Tasks
-
Cron
A simple serverless Cron job.
-
Queues
A simple queue system with SQS.
-
Pub/Sub
A simple pub/sub system with SNS.
-
Resize Images
Automatically resize images uploaded to S3.
-
Kinesis data streams
A simple Kinesis Data Stream system.
-
EventBus
A simple EventBridge system with EventBus.
Editors
-
Debug With VS Code
Using VS Code to debug serverless apps.
-
Debug With WebStorm
Using WebStorm to debug serverless apps.
-
Debug With IntelliJ
Using IntelliJ IDEA to debug serverless apps.
Monitoring
Miscellaneous
-
Lambda Layers
Using the @sparticuz/chromium layer to take screenshots.
-
Middy Validator
Use Middy to validate API request and responses.